

Cycle Time Report
Access this report
- Click the Metrics icon in the top/right navigation.
- Click on the section Cycle Time in the Metrics menu
Use this report
Cycle Time is about responsiveness. It’s calculated from the time a card is worked on by the team until the time the card is delivered. In simple terms, it’s how long a card stays within the Work-In-Progress (WIP) columns of your board.
You can select the following options to display the data:
- Display Options to choose between card labels, priority, size, and custom fields
- Time Options to select a periodicity (daily, weekly, monthly, quarterly) and custom date range
- Board Filters to filter the data by selecting which columns to include within each of our column states
- Card Filters to filter the data by the owner of the card, card labels, and custom fields
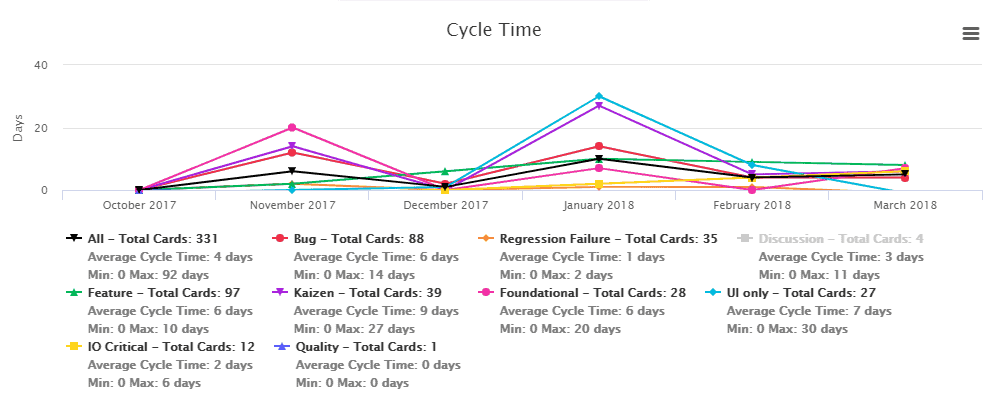 In the example above, we have nine colored card labels that can be included or not in the report by clicking the label in the legend below the graph. As you can see we chose to not include the label “Discussions”, which is grayed out in the legend. To set up card labels that will show up on the report, you must create these colored card labels using the customize cards option for your board. We also offer a different way to look at your cycle time using splatter plot visualization. In the graph below the cards are individually shown as dots on the day they were marked as done. This other view will show you any outliers and also your overall cycle time with upper and lower limits.
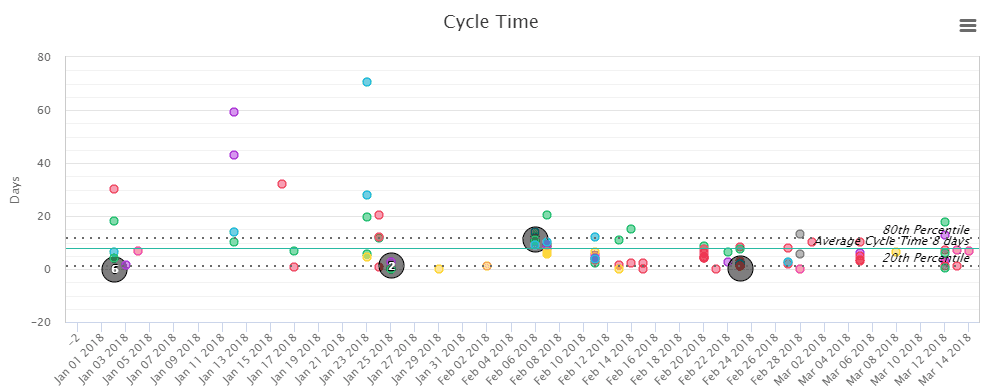
Show Detailed Data
From the Metrics left panel you can choose to display on the graph, the table, or both. When selecting table or both, you will see a table that works like our Table zone. This is where you can see all the data associated with the graph generated for this report and perform many actions to analyze your data. For example, you can group, sort, filter, pivot, and even create additional charts from this data. Be sure to select a few cells in the table and right-click to display a contextual menu with additional options.


