

Table Zone
Access
- Click the Productivity Zone menu to the right of the Kanban Zone logo.
- Click on Table
Use
Select Boards
The first step is to select one or more boards to display in Table Zone. This can be accomplished by clicking the board menu below the Kanban Zone logo. Use the checkboxes next to each board name to add the data from that board to the table.

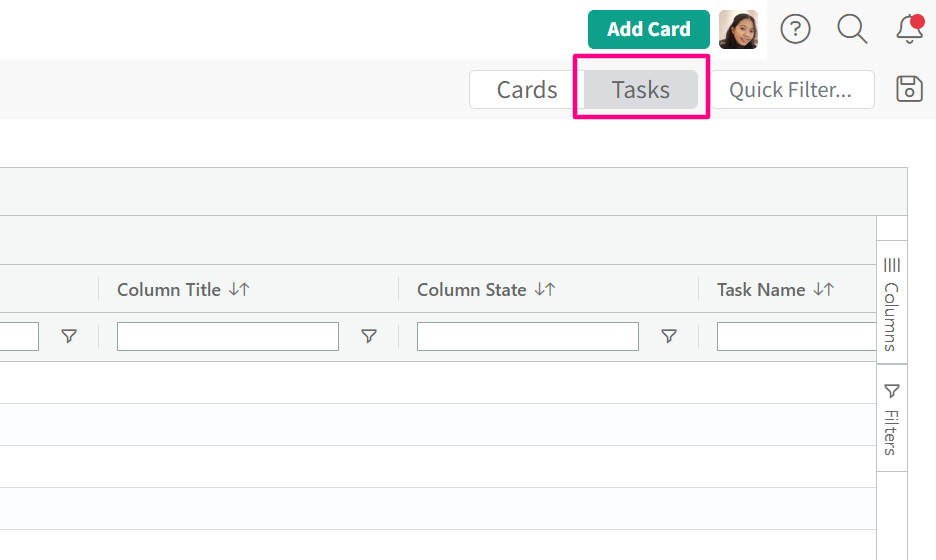
Switch to Task Data
By default, the data that are displayed in the table will be cards. But you can switch it to tasks by clicking on the ‘Tasks’ button in the top-right corner.
Once you click ‘Tasks’, you’ll be able to see the tasks, grouped by Card Title > Checklist. The grouping is there to help you get started. You can remove or change it.
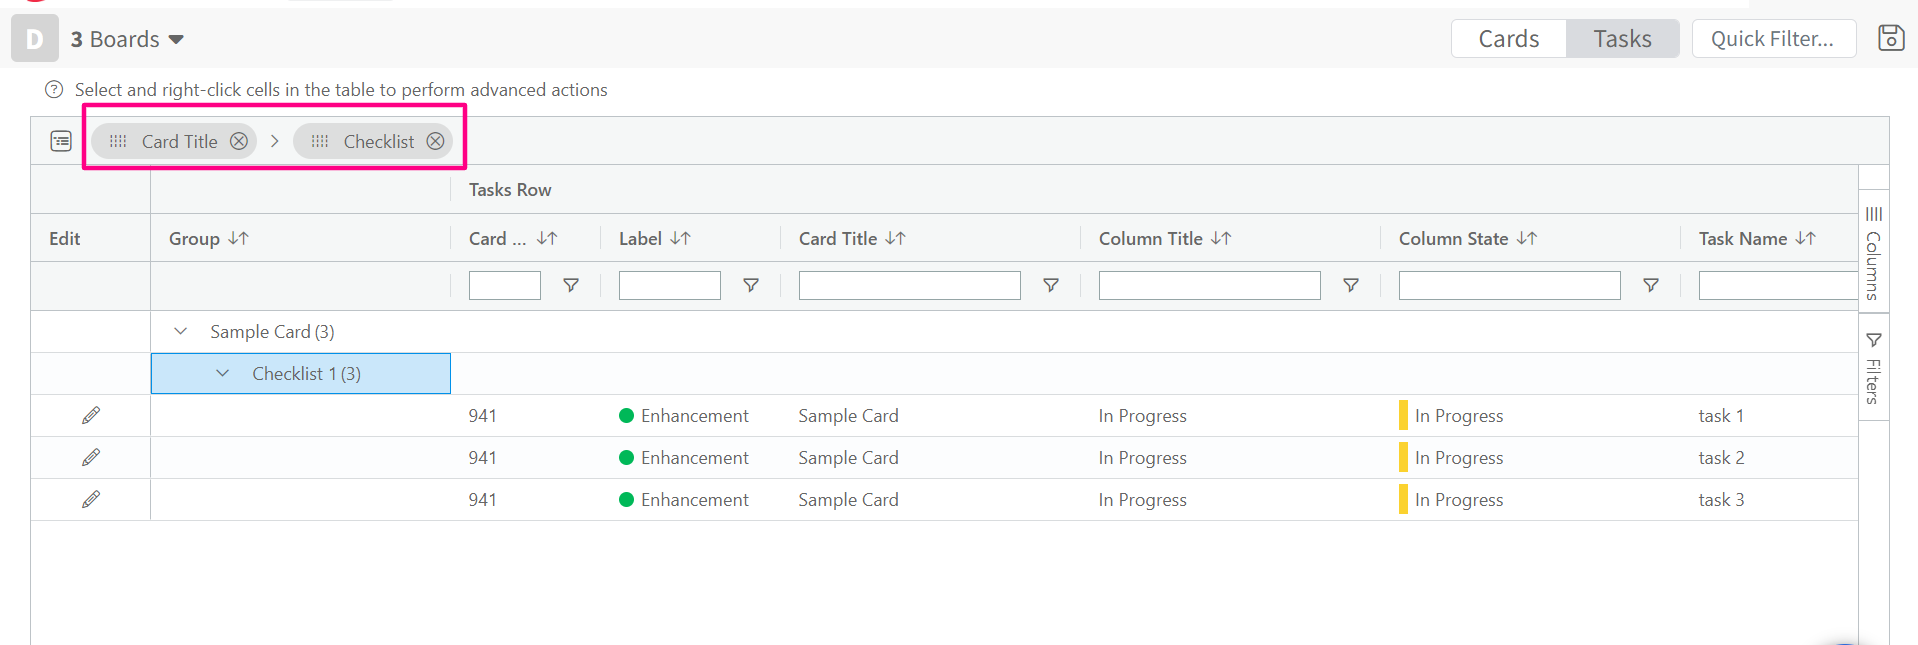
Any settings or actions that can be done on Cards data can also be done on Tasks data.
Select Columns
Now that you have all your data in the table, you can select additional columns to view in the table. By default, we only include basic columns like board title, column title, column state, and basic card fields (ID, Label, Title, Owner, Watchers, Blocked, Blocked Reason, Size, and Priority). Click on the Columns tab on the right of the table to open the list of available columns.

As shown in the screenshot above, only the columns with a blue checkbox are included in the table, but you can add many more fields that are organized in categories (Dates, Metrics, Checklists, Links, etc…). If you have custom fields on the selected board(s), then you will also see a category called Custom Fields.
From this column tab, you will notice a toggle at the top called Pivot Mode. If you enable this option, then you can pivot your data just like you would do in a spreadsheet.
Organize your data
Once you have all your boards and the columns you need in the table, you can perform many actions on this data. Here is the list of actions:
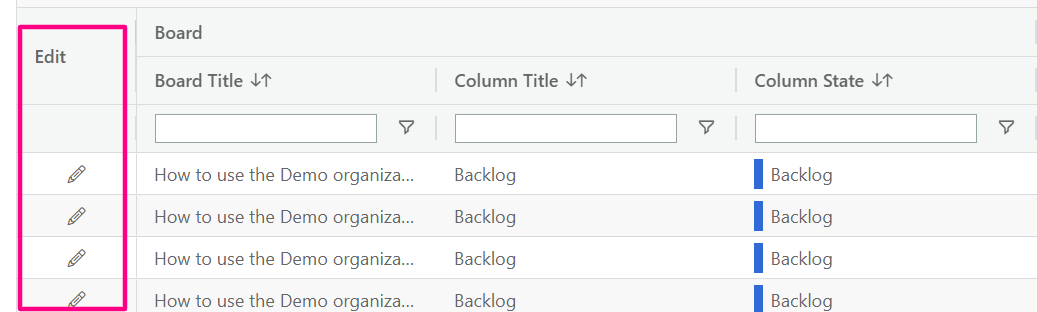
- Edit – The first column on the left of the table is called Edit and it’s pinned. Suppose you want to open a card from the table simply click the edit pencil icon in that column.

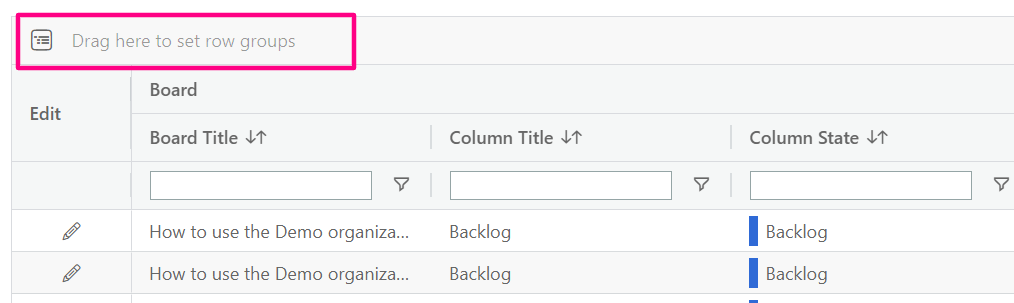
- Group – Drag and drop a column name in the “Drag here to set row groups” to group your data by this column. You can add additional grouping in the order that works best for you.

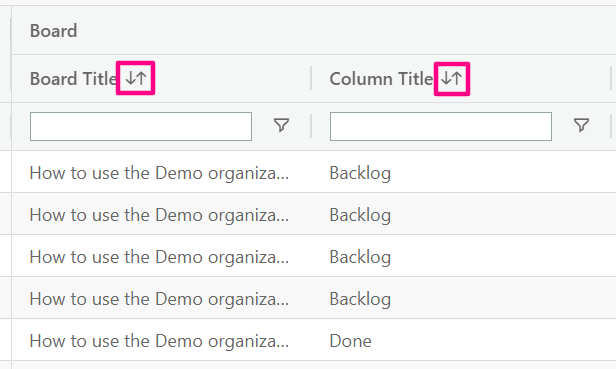
- Sort – Next to the title of each column in the table, you will see up/down arrows that once clicked will sort your data in ascending order. If you click it again, it will show your data in descending order, and if you click it again it will remove the sorting.

- Filter – Below each column in the table, you will see a text box to filter that column by the text you entered, or you can click the filter icon next to that text box to see advanced filter options. You can also use the Filters tab on the right of the table.

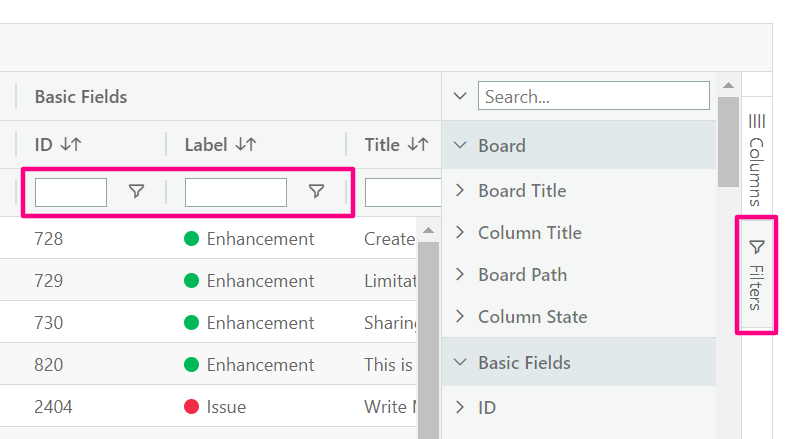
As shown in the screenshot above, the Filters tab shows all the columns (not only the ones you selected in the table). This permits you to filter data for columns that are not displayed on the table.
Total your data
When displaying a column that contains numbers from customer fields or metrics, you will see a Total calculated at the bottom of the table and within each grouping.

Right-click to perform more actions
The table is interactive and can perform many more actions. Simply right-click on any cell or a selection of cells to open the contextual menu with the following actions:
- Copy – This will copy whatever data you selected in the table to your clipboard.
- Chart Range – This will permit you to create charts directly from this table, based on your selected data. There are too many charts to list, but here are the chart categories: Column, Bar, Pie, Line, Scatter, Area, and Histogram.

Export – You can export all the data in the table by right-clicking on any cell or clicking the Export icon at the top/right of the table.
Save Views
When you find an ideal way to view your data, you have a way to save it.

- Once you like your setup, click the ‘Save As’ icon on the top-right corner of the table.
- Name your view.
- Click ‘Save’.
Now, you can access your saved view anytime by clicking on the ‘Save As’ icon, and then clicking the name of your saved view in the ‘Previously Saved’ list. You can also rename and delete the view by clicking the icons next to the name.


