

Flow Efficiency Report
Access this report
- Click the Metrics icon in the top/right navigation.
- Click on the section Flow Efficiency in the Metrics menu.
Use this report
The Flow Efficiency report helps you measure from 0-100% how your cards efficiently flow to completion, with the following options to display the data:
- Time Options to select a periodicity (daily, weekly, monthly, quarterly) and custom date range
- Card Filters to filter the data by the owner of the card, card labels, and custom fields
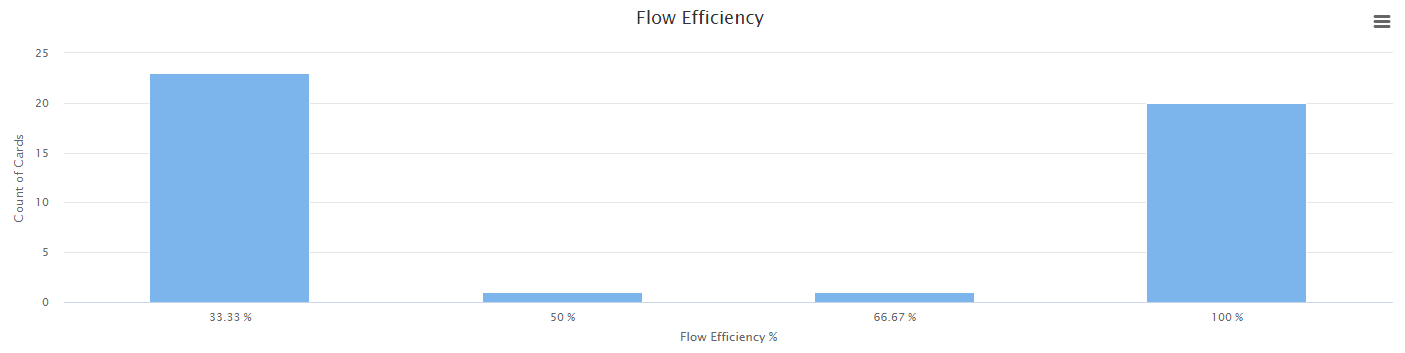
The columns associated with the column states of In Progress (yellow) and Buffer (orange) are used to calculate the flow efficiency percentage by using this formula: (In Progress Time / (In Progress Time + Buffer Time)) x 100%.
Show Detailed Data
From the Metrics left panel, you can choose to display on the graph, the table, or both. When selecting table or both, you will see a table that works like our Table zone. This is where you can see all the data associated with the graph generated for this report and perform many actions to analyze your data. For example, you can group, sort, filter, pivot, and even create additional charts from this data. Be sure to select a few cells in the table and right-click to display a contextual menu with additional options.


