

Understand if you are meeting expectations.
The created vs done report looks at both arrival rate and throughput data to see if you are producing more or less than what’s expected from you. When you see blue it means that you are negative for that time period as you have created more work items that you have completed. When you see green it means that you are positive for that time period as you have completed more work items that you have created.
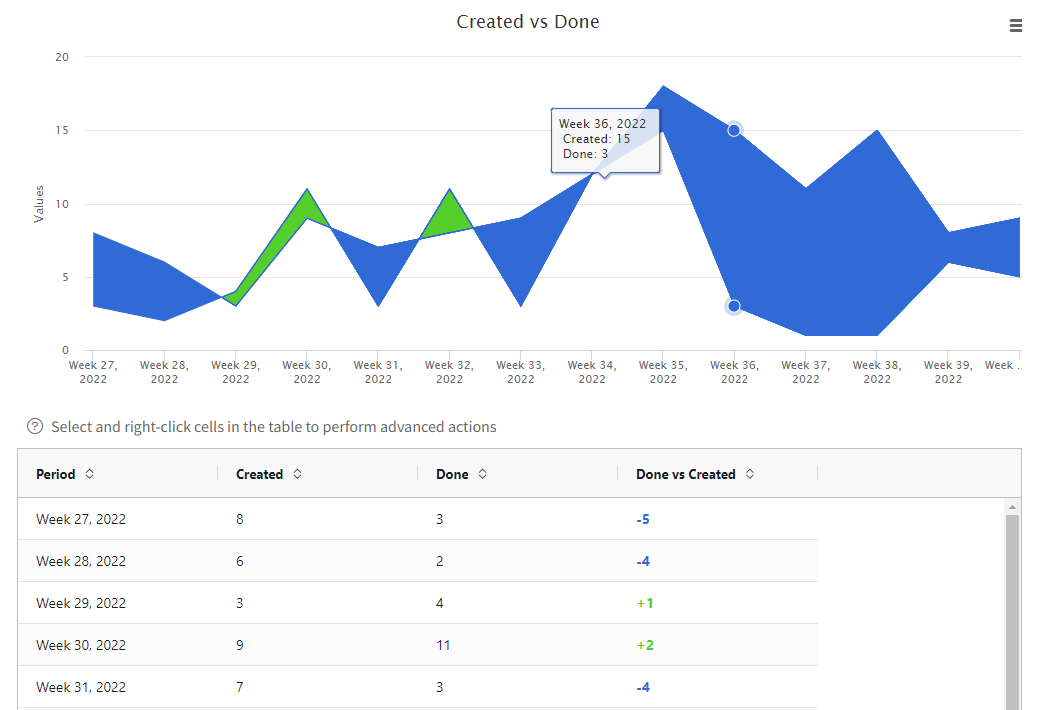
In the screenshot above we show both the graph and the detailed data behind it. Although seeing both the graph and data is available in all our reports, it’s especially helpful in this report to quickly see how much you were actually over or under.
Learn more about this Arrival Rate report in this knowledge base article.


