

Forecast Zone
Access
- Click the Productivity Zone menu to the right of the Kanban Zone logo.
- Click on Forecast
Use
The Forecast zone provides the ability to predict the future (forecast) based on actual historical data from a board in Kanban Zone and the Monte Carlo simulation. There are two ways to run a forecast:
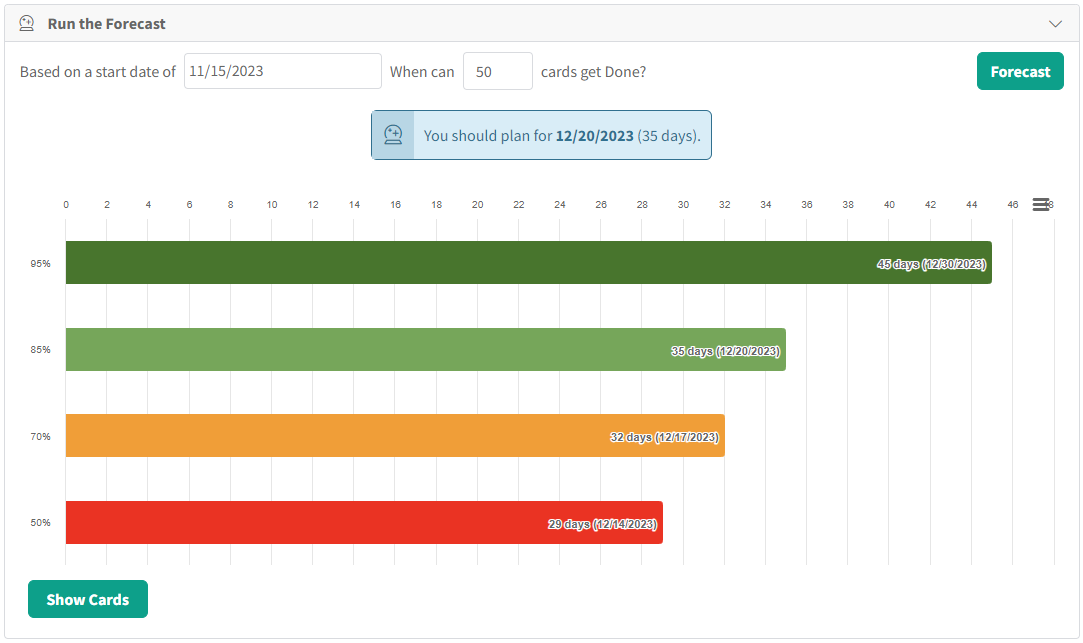
1. By Date
If you want to know how many cards can get Done by a certain date, then simply enter a target date and let the forecast answer that question.
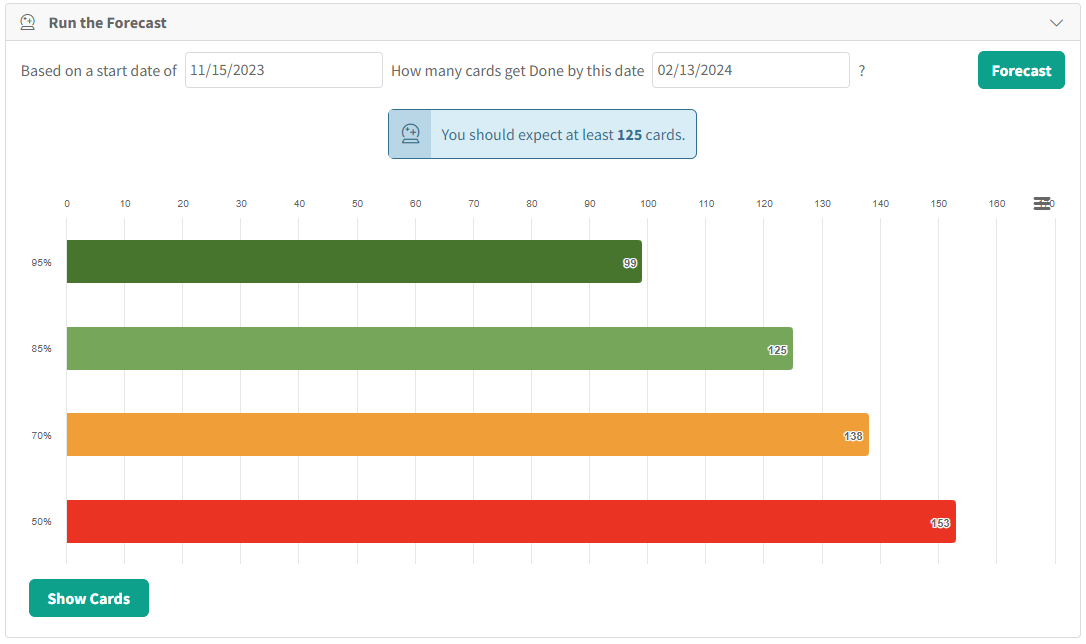
2. By Scope
If you want to know when a specific number of cards get Done, then simply enter a target card number and let the forecast answer that question.
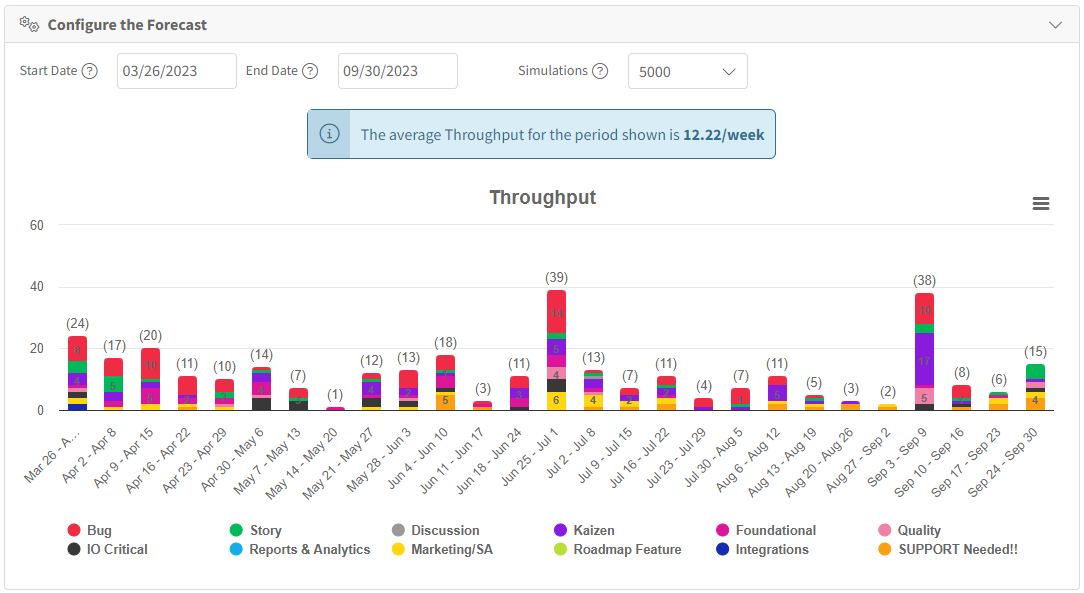
Configure
The forecast is based on actual historical data that you can select using a date range under the Configure the Forecast section. As you modify the date range, you will see the corresponding throughput (number of Done cards by week) in the graph and in the blue box your average throughput. We recommend a minimum of 3 months of data and you will see the best forecast when selecting 12 months (or more).
See it in action
Since this is an advanced feature, watch this 3-minute video to learn how to best use the Forecast. In this video, you will also see the ability to see exactly which cards can be included in your forecast by clicking the Show Card button.


