

Time Distribution Report
Access this report
- Click the Metrics icon in the top/right navigation.
- Click on any reports to access the Metrics area.
- From the Metrics Options panel click on the report dropdown to find Time Distribution.
Use this report
The Time Distribution report helps forecast your work based on historical data. There are 3 axes on this graph, the X-axis represents the periodicity, the Y-axis shows the number of cards completed within each period, and the Z-axis calculates the overall percentage of cards completed across the displayed period of time.
You can select the following options to display the data:
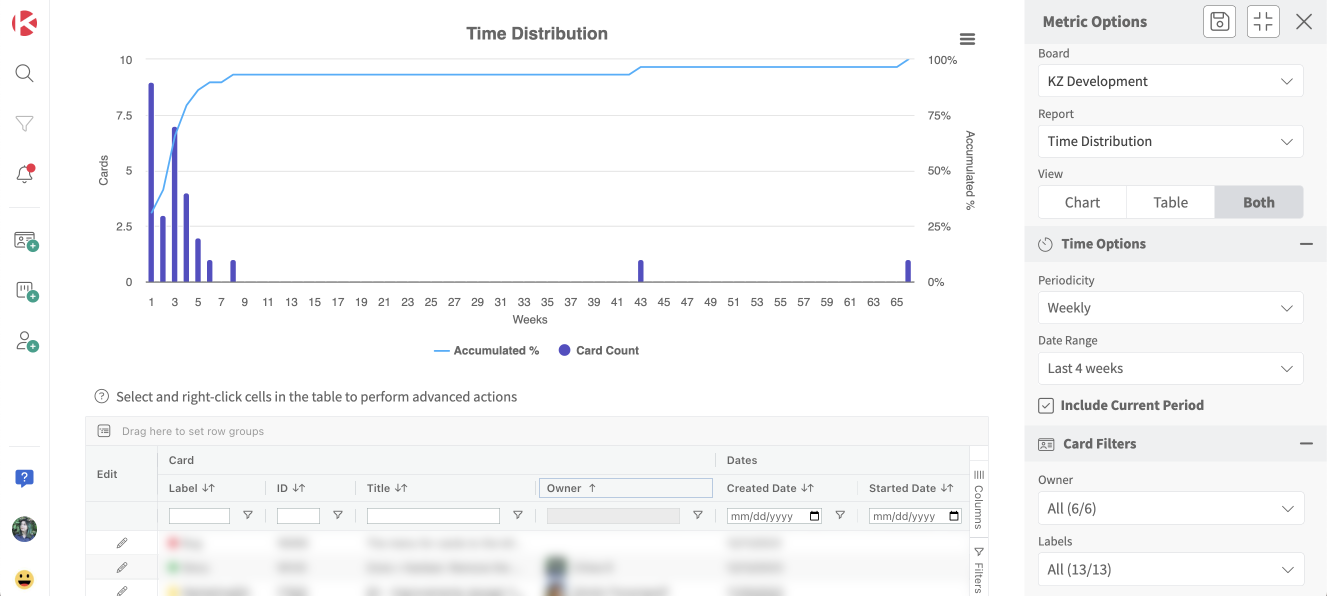
- Time Options to select a periodicity (daily, weekly, monthly, quarterly) and custom date range
- Card Filters to filter the data by the owner of the card, card labels, and custom fields
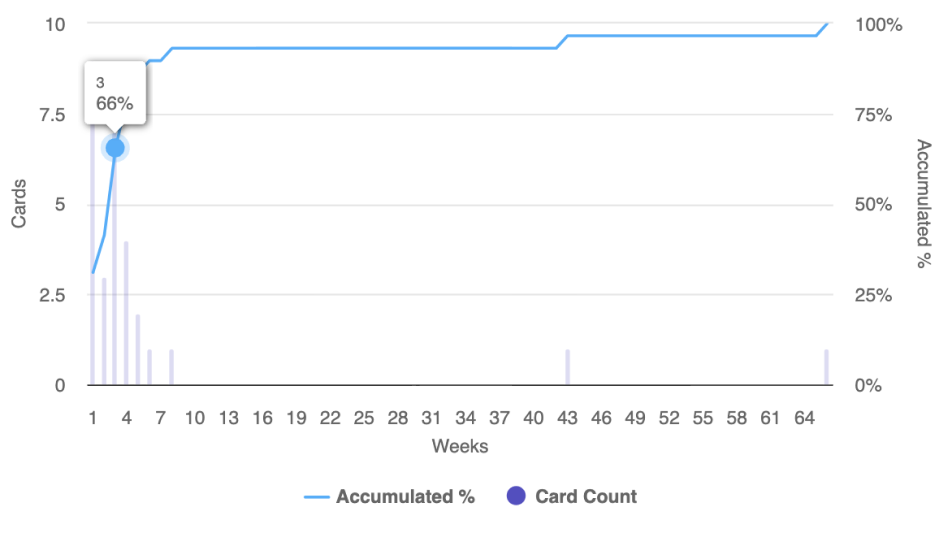
In the example above, 66% of the work got completed within 3 weeks. Although a few cards took longer, you can use this information to set expectations for future work. In this case, it’s fair to expect that there is an 66% chance that new work should get done within 3 weeks. This is not a guarantee, but if you continue to keep creating cards of roughly the same size as the ones you have been delivering, which is a key concept in the Kanban method, then you should expect that this team or process can continue to deliver at this pace.
Show Detailed Data
From the Metrics left panel you can choose to display on the graph, the table, or both. When selecting table or both, you will see a table that works like our Table zone. This is where you can see all the data associated with the graph generated for this report and perform many actions to analyze your data. For example, you can group, sort, filter, pivot, and even create additional charts from this data. Be sure to select a few cells in the table and right-click to display a contextual menu with additional options.
Related Information


