

Understand how long it actually takes to complete work.
Based on your past results, you can evaluate how long it takes to complete your work. The time distribution graph presents the number of cards that got completed over a period of time. It also informs you about the percentage of work that got done by a certain time. This report provides a great way to set expectations based on actual work, instead of wishful thinking!
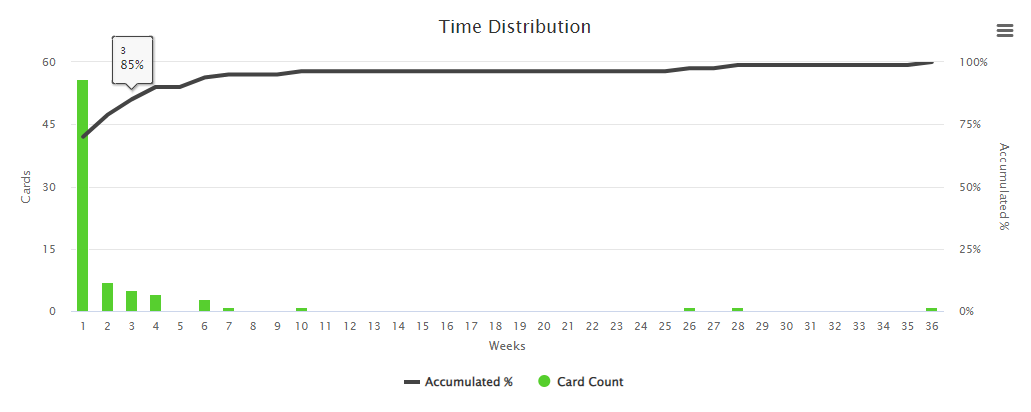
The screenshot above shows the following data for the first 3 weeks:
- 70% of the work within this time period was completed within 1 week (56 cards took 1 week or less)
- 79% of the work within this time period was completed within 2 weeks (7 cards took between 1-2 weeks)
- 85% of the work within this time period was completed within 3 weeks (5 cards took between 2-3 weeks)
As you can see most of the cards (85%) were completed within 3 weeks. Although some cards took longer (15%) and a few cards took very long (26, 28, and 36 weeks), the time distribution report provides a simple way to inform people that any new work being delivered on this Kanban board usually takes less than 3 weeks and that most of the work (70%) can often get done within a week.
Learn more about this Time Distribution report in this knowledge base article.


