

Track your responsiveness.
Compared to the other Kanban metrics, cycle time is designed to measure the time it takes for a card to flow through the process steps (columns) of your board. The default cycle time is calculated from the time a card enters a WIP column to the time it enters a Done column. This is how long it took the team to complete the card.
For example, the card was created on Monday and it stayed in the Backlog or a To Do column of your board until Wednesday. The team picked up the card on Wednesday, moved it to a WIP column, and then completed the card on Friday by moving the card to a Done column. The card took 3 days (Wednesday to Friday) to get worked on, so the cycle time of that card is 3 days. To the customer, it felt like 5 days because the card was created on Monday and completed on Friday (5 days), but in reality, it only took the team 3 days.
The time the card took prior to hitting a WIP column is called lead time, so the total time it took to deliver the card is 5 days, but the detail should show 2 + 3 = 5 (Lead Time + Cycle Time = Total Time).
The reason we must focus on the cycle time is because the team must use this number to set expectations about the time it will take to actually produce the work. The team might not be responsible for the time the card stayed in the backlog, or the time it took someone outside of the team to create the card. We fully understand that to the customer it’s the full time that counts, but in order for the team to measure their responsiveness, it must focus on the cycle time.
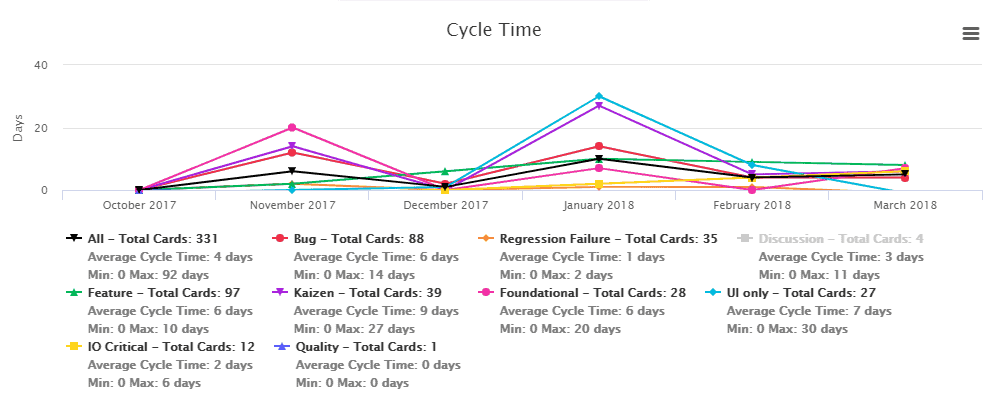
The screenshot above shows a line chart of your cycle time per card label. For this board, the team has decided to create 9 card labels represented by different colors. This provides a cycle time for each card label, but you can also see that the overall cycle time for all the cards is shown as 4 days.
Based on this data Feature cards shown in green took 6 days, but other types of cards had different cycle times ranging from 1 to 9 days. If someone needed a Feature card from this team, we would set the expectation at 6 days.
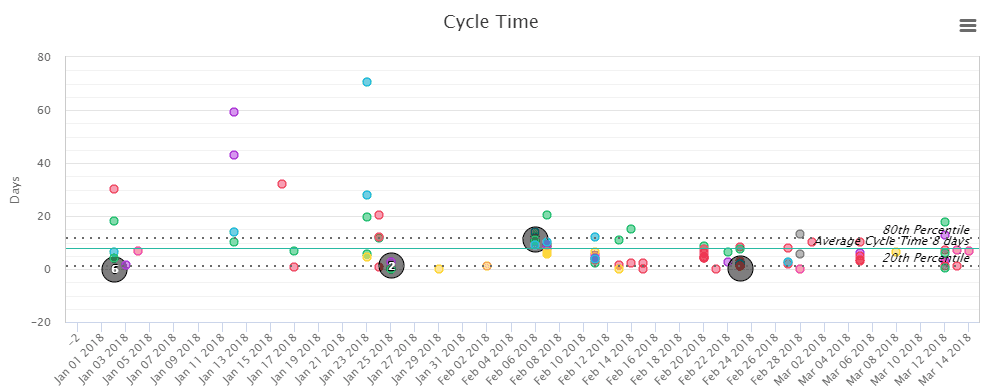
The screenshot above shows a scatter plot chart of your cycle time per card label. The dotted line shows the control limits and the green line shows the average. Any card outside the control limits took more or less than what was expected or acceptable for this team. This chart is very helpful to identify and learn from the cards outside the control limits. The team should seek to understand why it took longer for some cards and what can be done to correct this in the future. This is one way for a team to embrace continuous improvement.
Learn more about this Cycle Time report in this knowledge base article.


