

Track wasted effort and improvement opportunities.
No matter how simple or complex is your Kanban board, you can track the average time spent and/or blocked in each column, to identify columns that are your bottlenecks.
In the example below, the Column Metrics show that the issue is not the time it takes to develop the software shown in the “Code” column, but instead the time it takes for this team to wait in the “Ready to Deploy” column. So instead of adding more developers or booking unnecessary meetings to fix development, the focus must be on WHY the work stays so long in “Ready to Deploy“. The issue could be related to a delay in getting approvals, or the need to automate this portion of the deployment process.
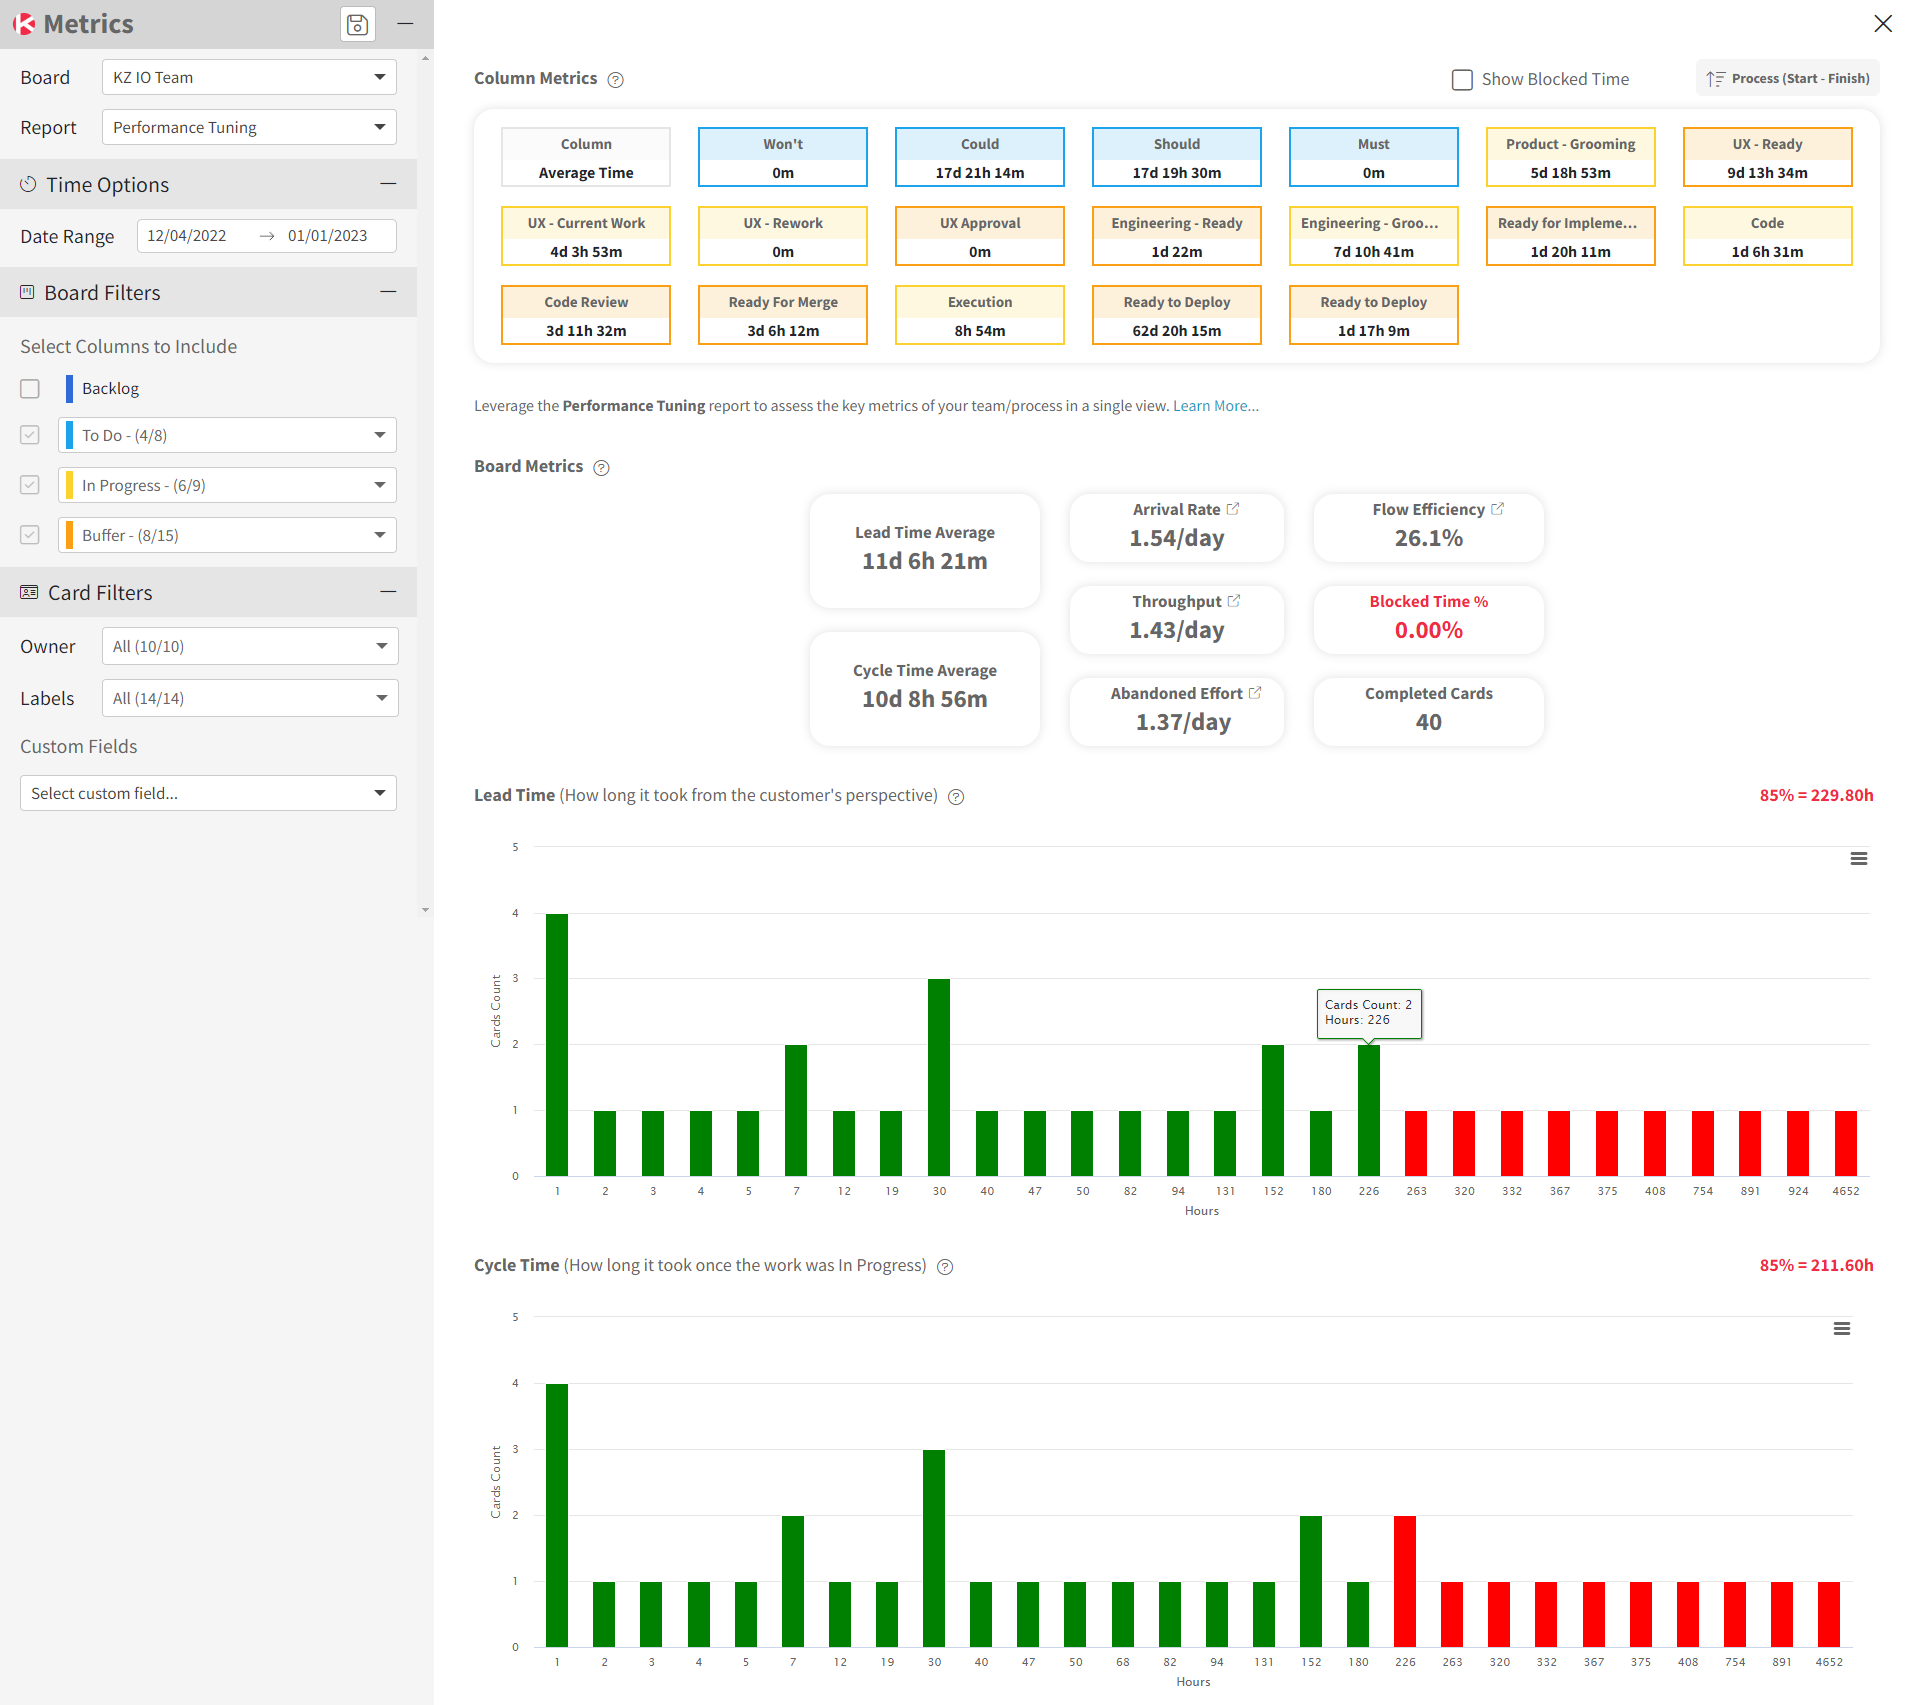
The Board Metrics provide a full picture of all the key ways to measure your performance. Based on these numbers you can quickly assess where to find improvement opportunities. In the example above the Lead and Cycle time averages are very close, so the customer is not experiencing delays upstream in the process, but we could find ways to improve our execution downstream. What is concerning is when comparing the Arrival Rate (new work) vs Throughput (completed work) vs Abandoned Effort (canceled work). This team procreates more work than it can handle (Arrival Rate > Throughput) and it cancels almost as much work as it completes and receives (Abandoned Effort is roughly the same as the Arrival Rate and Throughput). This team must investigate WHY it abandons so much work, which is very wasteful, and be aware that its productivity might need to be augmented or expectations must be reset that work will accumulate in the Backlog.
Lastly, the two graphs represent the Lead and Cycle times (ie: the time it took from the perspective of the Customer vs how long it took Operationally to complete the work once it was pulled In Progress). The 85% represents a control limit to identify all the work that took longer than 85% of the overall work. It’s important to review that work to understand WHY these particular work items took longer.
Learn more about this Abandoned Effort report in this knowledge base article.


