The constant challenges that businesses are currently facing in order to stay competitive in their fields of work is getting huge over time and often putting enormous pressure on work teams.
In this sense, it is crucial that project managers look at ways to achieve efficient workflows aiming at delivering high quality products or services to customers. Managing efficiently the process workflow is key to fast delivery and process predictability.
Diverse methods are at disposal and can be used to support companies and project managers to achieve these demanding requirements. The Kanban method turns out to be one of such possible methods, and has been showing its importance in diverse industries over the years.
Important metrics associated with the process workflow can be obtained by using the Kanban method, as for example, lead-time, cycle time, throughput, WIP, and others.
One of the most relevant Kanban metrics is workflow efficiency which is the main focus of this article. In the following sections you will get the main idea behind the workflow efficiency metric and how to optimize it without the risk of overburdening the team.
What is Workflow Efficiency?
Before understating the concept of the workflow efficiency metric, it is important to comprehend what workflow is all about. From a broad perspective, the term workflow refers to the way processes are carried out, that is, the step by step necessary stages in a process in order to deliver a product or service.
Having that in mind, the workflow efficiency metric refers to a process indicator that expresses the ratio between the time period in which work is truly being carried out (also known as value-added time) and the total required time duration to complete a work item (also known as lead time), Equation 1.

If you want to better understand the concepts related to value-added time and lead time, take a look at the article Flow Efficiency: How to Measure it and Why You Should.
The workflow efficiency metric allows a better understanding of both the strengths and weaknesses of the process under consideration. This contributes to implementing possible actions in order to continuously improve the process.
How to Optimize Workflow Efficiency without Team Overburden
The optimization of workflow efficiency is critical to companies and businesses in general and should be put into practice as often as possible. Nonetheless, when trying to optimize their process workflow efficiency, it is not uncommon that project managers opt to follow the path of allocating too many hours to their team in order to push it hard to accomplish the project´s goals in terms of time, scope and quality.
Maintaining the team full-time has many disadvantages and often leads to problems as for example, extreme demand, delayed outcomes, anxiety and overload. Multitasking is another common problem that arises as well, which is characterized by a constant switch of context regarding work items being worked on, thus making it difficult to maintain the team focus on delivering suitable work.
All these disadvantages hinder the establishment of smooth process workflow and decrease its efficiency. Therefore, instead of choosing the “full-time busy” way of work, project managers should opt to balance the project´s demands with their current team capability. This can be done by defining limits to the WIP (work in progress) in the process, which refers to the number of work items that are currently being worked on.
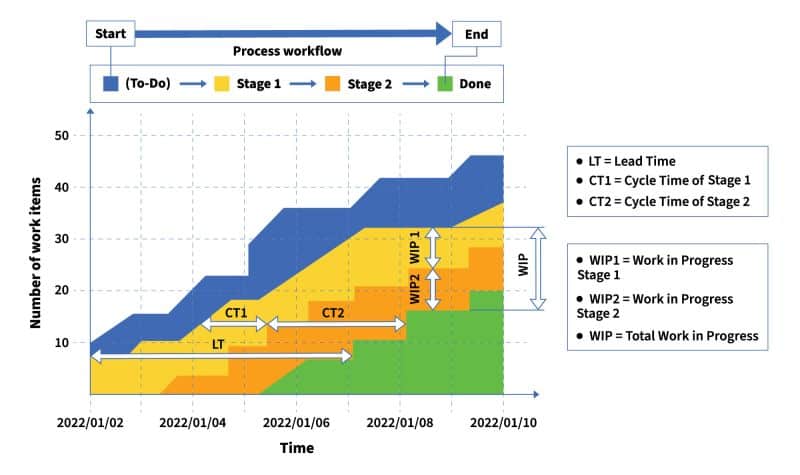
Digital Kanban boards can be used not only to visualize the process WIP but also to monitor it over time. One powerful tool that can help to optimize the workflow efficiency of the process is the cumulative flow diagram (CFD). Basically, the CFD tracks the total number of work items in the team´s digital Kanban board, Figure 1.

Figure 1 shows an example of CFD related to the progress of a process over time. The process is composed of four steps which can be interpreted as specific columns in a digital Kanban board. The initial step of the process is depicted by the “To-Do” list, at the left-hand side of the process workflow, whereas the final step of the process (“Done”) is shown at the end of the process workflow and represents the completed work items.
The y-axis indicates the number of work items and the x-axis shows the time duration. It is possible to note that the graph has four colored areas, which represent the total amount of work items handled by the team, throughout the process workflow, on any specific day.
Each area in the CFD is defined by a top line and a bottom line. The top line of each area denotes the demanded rate of work items while the bottom line represents the yield rate of work items.
The horizontal distance between the top and bottom lines in the areas related to either Stage 1 or Stage 2 of the process workflow characterizes the average cycle time of each process stage (Figure 1, CT1 and CT2, respectively). The average process lead time (LT) is represented by the horizontal distance between the first step of the process (“To-Do”) and the final step of the process (“Done”).
On the other hand, the vertical distance between the top and bottom lines of process Stage 1 or Stage 2 on a given date designates the process WIP of each process stage (Figure 1; WIP1 and WIP2, respectively). The sum of both values denotes the average process WIP.
The stability of the process workflow can be inferred by monitoring the process WIP. In case the process WIP is consistent over time (i.e. the distance between the top and bottom lines in both Stage 1 and Stage 2 areas grow in parallel), so the process workflow can be considered stable, and no further action is required. Nonetheless, if the process WIP gets higher over time (i.e. distance between the top and bottom lines in both Stage 1 and Stage 2 areas enlarges exaggerated) this shows that the demanded rate of work items is higher than the yielded rate of work items. In this case, possibly the work team is facing problems to stick to the required work demand and further actions must be implemented.
By correctly monitoring the process WIP through CFD it is possible to achieve a balance between the project´s demands and the current team capability, thus contributing to the optimization of workflow efficiency without team overburden.
Learn to Work Smarter, Not Harder!
Get our top articles weekly.
Table Of Contents
Discover many more posts…


