In the context of Agile methodologies, the Kanban method has gained significant application over the years aiming at better controlling and understanding the process flow required to deliver high quality products or services.
The Agile Kanban method permits inferring specific metrics (sometimes also known as terms or parameters) associated with the process under consideration, as for example, lead-time, cycle time, throughput and many others, which are also well known from the field of Lean Manufacturing and continuous process improvement.
Among the main metrics commonly used through the Kanban method, the cycle time metric is considered one of the most relevant and is the focus of the present article. Understanding this metric can work wonders as it is a highly helpful parameter and controlling it significantly effects the overall efficiency of your process.
Would you like to get more insights about cycle time and how to calculate it? Let’s first understand what it really is about.
What is Cycle Time?
From the manufacturing point of view, cycle time can be understood as the time required for the execution of a part or part batch in a specific process step or in a value stream process. In other words, it is the total period that is spent from the beginning of the manufacture of a part (or part batch) until the final product is finished, including the waiting time for raw material, setup time of machines, material loadings and any breaks in production.
Based on the manufacturing context, it is also possible to define cycle time in the framework of Agile Kanban method. So, in this case, cycle time designates, for example, how much time the team has dedicated to work on a defined task. It allows teams to control the start and finish times of project´s tasks, hence their overall delivery capability.
Importance of Cycle Time
You may have already realized that cycle time is one of the most important metrics regarding the interface with production of goods and services as well as from the Agile Kanban method perspective.
This metric makes it possible to clearly map the required time for a product or service to be finished and ready for the customer. Despite this being considered as one of the main importance of cycle time, other relevant aspects can be comprehended when correctly using and understanding this time metric. These are summarized as follows:
- Ensure quality and on-time deliverables, thus increasing customer satisfaction;
- Determine the deadlines for internal clients of the process;
- Allow to reach the deliverable time of products or services based on the overall lead time. Lead time is an additional important metric in Agile Kanban method which is going to be addressed in another article;
- Provide helpful inputs aiming at reducing costs and idle capacity of the process;
- Reduce existing process bottlenecks and affords process optimization.
At this point, you might be wondering how to calculate cycle time and use this metric to improve business processes? That’s exactly what we’ll see right now!
How to Calculate Cycle Time
In order to calculate cycle time, it is important firstly to differentiate between two possible situations: a) single flow item (or task) and b) batches of items (or tasks). For a single flow item (SFI), cycle time is calculated by subtracting the time the item was finished from the time the item has started, Equation 1.

For example, let’s say a project task starts at 9:30h a.m., and it is finished at 11:30h a.m., so the total cycle time for completing that task is two hours.
On the other hand, in case we are dealing with batches of items (BoI), the cycle time can be determined by diving the total time duration for completing the items (i.e Finish Time – Start Time) by the total amount of items produced during this period.

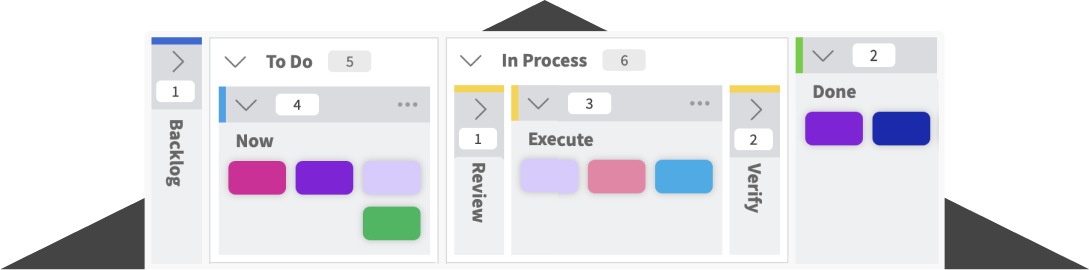
In Agile Kanban method, calculating cycle time is extremely easy by using an appropriate Kanban board:

Basically, the Kanban board shown above consists of a chart representing the progress of a process over time. The left-hand side column depicts the initial step of the process, and the farthest column at the right shows the end of the process. The vertical columns show the different steps of the process and their work in progress (WIP) items whereas the horizontal axis designates the evolution of items in the process over time. The basic columns in the Kanban board are usually “backlog” (or “to do” list), “in-progress”, and “done” (completed tasks). However, in order to further detail the process, it is also possible to add more columns designating intermediary required steps of the process.
To calculate cycle time by using Kanban boards you would register the date and time of an item at the right moment it moves from the “backlog” column to the column “in progress”. After the item has been moved to the total extent of the Kanban board, you can record the exact date and time associated with the moment in which the item reaches the column “done”. Then, cycle time can be calculated based on this information.

Monitor Your Efficiency with Kanban Zone
Tracking your project’s cycle time can be a good thing to incorporate in your processes if you want to have better insights on your team’s overall productivity. But if you have to do it manually, it can become burdensome to keep indicating them on the cards in your Kanban board. Here at Kanban Zone, we have made it easier for you to record your turnaround times by automatically recording the start and end dates of your Kanban cards. You can also opt to record your planned dates of start and completion for each task, so that you can then compare if you have been sticking to your scheduled project timeline.


If you want to check your cycle time report for your board, simply click on Cycle Time from your board’s Metrics section and gain a better perspective of your team’s overall performance in completing tasks on the board.
Check out Kanban Zone today and find out how much easier it is for you to track your project’s cycle time through our virtual Kanban board.
Learn to Work Smarter, Not Harder!
Get our top articles weekly.
About the Author: Adriano Boaron
Related Posts


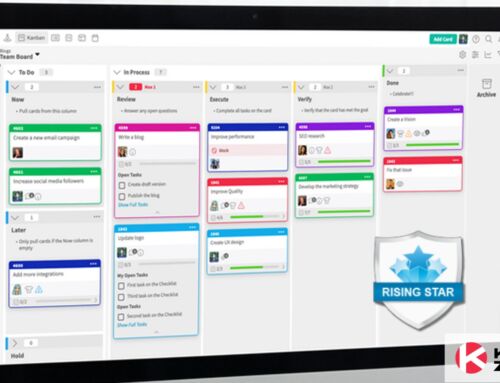
Table Of Contents
Discover many more posts…