Metrics in Kanban are all about understanding the flow of the cards on Kanban boards. In this article, we will focus only on Throughput and Cycle Time. With these two reports and their average over time, we should be able to provide any team (or process) a simple way to track their maturity over time.
Throughput is about performance
Throughput is based on actual data to represent the number of cards delivered in a given period of time on a specific digital Kanban board. This metric will provide the team represented on a Kanban board a way to track their performance over time.

In our example above, the team has delivered 10, 8, 12, and 10 cards in each of the last 4 weeks. The average throughput is 10 cards per week. As the team keeps tracking its throughput, it will also seek ways to improve it over time.
Note: The throughput strictly counts cards, it does not take into account the fact that the cards might be of different sizes. If your cards greatly vary in size, then you must take that into consideration a variance to apply to the average number. Over time, mature Kanban teams will naturally create cards that are roughly the same size, which helps but doesn’t completely remove this caveat.
Learn more about the Throughput report in Kanban Zone.
Cycle Time is about responsiveness
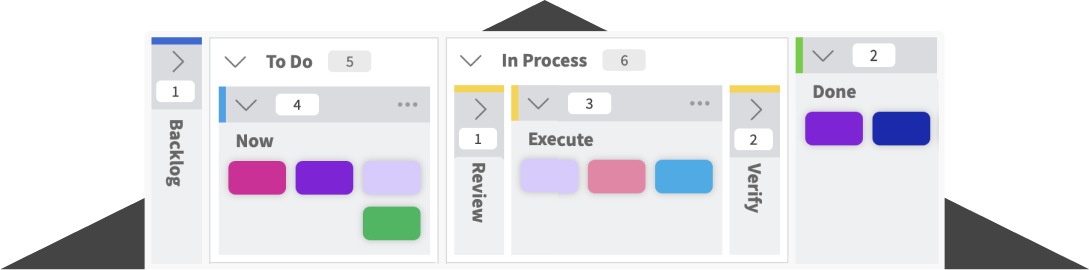
Cycle Time is calculated from the time a card is worked on by the team until the time the card is delivered. In simple terms, it’s how long a card stays within the Work-In-Progress (WIP) columns of your board.

In our example above, the cards that made it in the Done column took 5, 3, and 7 days. The Cycle Time for this Kanban board is 5 days, which is the average length of the time each card took to get delivered on this Kanban board.
Note: On a simple Kanban board like the illustration above, there are no regular interruptions in the process (columns in the board) that cause cards to be waiting on a third party. This means that the calculation is very simple. Some Kanban boards might have columns to exclude from the cycle time. If you seek to only get the cycle time when the team is actively working on the cards, then you might exclude specific columns. If you just want to know how long it takes for work to get completed (including any delays outside of the team), then include all columns.
Learn more about the Cycle Time report in Kanban Zone.
Cycle Time and WIP to estimate…
In a previous article about estimation in Kanban, we discussed the option to not estimate each card but instead rely on Kanban metrics.

In our example above, the Cycle Time for this Kanban board is still 5 days, and the WIP limit is 3 cards. With these two numbers, we can quickly estimate how long cards in the “To Do” column will take to flow to the “Done” column. The first card in the “To Do” is 5 days away, the 4th card is 10 days away, the 7th card is 15 days away, etc… Every 3 cards (WIP limit) after the first card in the “To Do” is 5 days more away (average Cycle Time).
Note: Not estimating each card will save you a lot of time, and since estimates are by definition never accurate, this estimation method will also not be accurate but good enough for the purpose of estimation. For this to work, you must respect the WIP limit, and your cards should roughly be the same size.
Behaviors drive outcomes…
Tracking these metrics on a regular frequency will provide teams the ability to ensure that the improvements or changes they are making are creating the right outcomes. Tracking the Throughput and Cycle Time for a team on a monthly basis will help see the trends for that team. If the average goes up, then let’s keep doing what we are doing. If it goes down, then let’s stop doing whatever we introduced, or figure out what has changed in that period of time.

Track your productivity using Throughput and Cycle Time
The goal is to continuously improve by driving positive behaviors that impact these metrics. For example, increasing the automation of certain activities within a process should increase both Throughput and Cycle Time. The same is true with eliminating wasteful activities within a process (muda), making a process flow more evenly (mura) or making sure to not overburden the process (muri). To learn more about Muda, Mura, and Muri, read this article Doing, Being and Flowing in Kanban (5P/3M).
Are you ready to leverage these Kanban metrics?
Learn more about throughput and cycle time, how to effectively use them as your Kanban metrics, and how you can easily generate these reports within Kanban Zone.
Learn more about Kanban…
- Leverage a Portfolio Kanban by connecting boards across your organization and linking cards.
- Build an effective Kanban board by following this simple 5 steps exercise.
- Build advanced Kanban board by using classes of services.
Learn to Work Smarter, Not Harder!
Get our top articles weekly.