As a professional services expert, you’re likely to have many plates spinning at once—budget constraints, time pressure, resource allocation, personnel management, and client communication are just some of them. Making sure you get all those decisions right for your clients can mean the difference between success and failure.
One way to achieve this is by using visual management and data analytics in project management, as it will help greatly with your decision-making strategy.
Ideally, you want to be proactive rather than reactive in your decision-making because this will make it easier for you to keep everything on track as the project progresses. In this article, we’ll explore why that is. We’ll also take a look at how you can use project management analytics to generate useful insights that help optimize your workflows. Let’s dive in.
What is Proactive vs. Reactive Decision-Making?
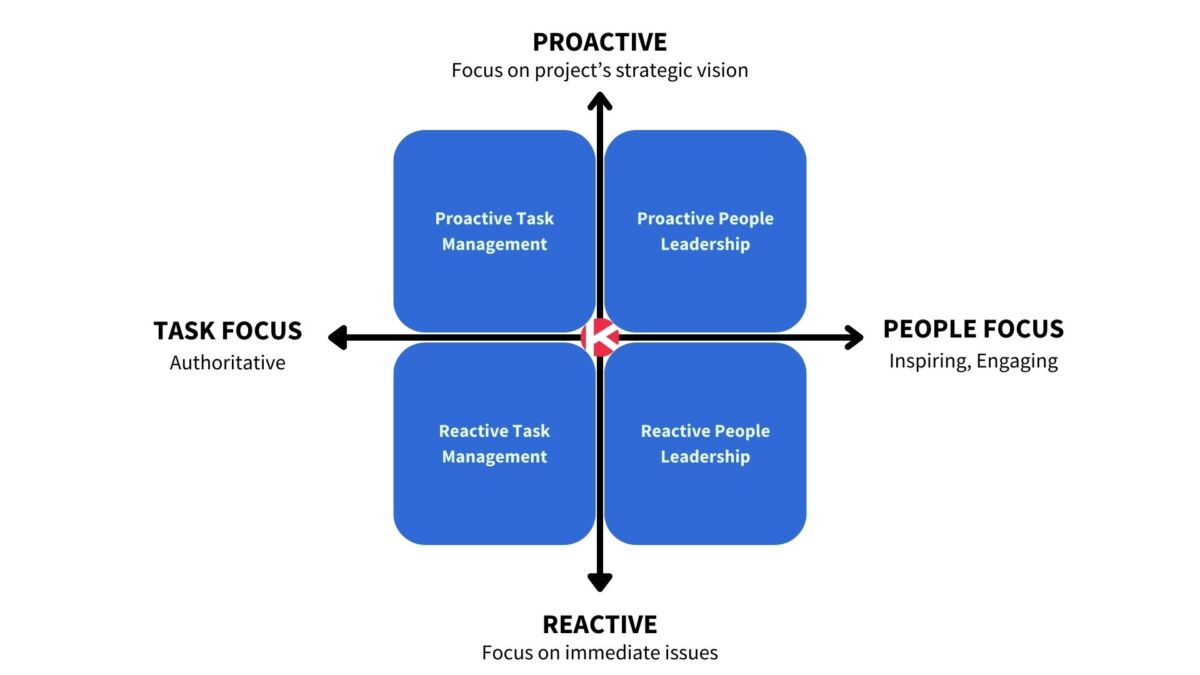
The distinction between proactive and reactive decision-making lies in when decisions are made. Reactive decision-making means responding to issues as they arise and making decisions based on the current situation. On the other hand, proactive decision-making involves planning ahead to reduce the likelihood of problems arising in the first place.
Both have benefits. For example, if a crisis hits, you need to be able to keep a cool head and make good decisions that will get your client’s project back on track. Even outside of crises, it’s beneficial to be flexible and adapt your plan to new information or situations. That said, most of your time and energy should be spent proactively making decisions and informed choices.
Leveraging in-depth analytics is a core element of the decision-making process in project management, so it’s crucial to have the right tools for the job so everything runs smoothly. A process mining platform can streamline workflows by providing detailed insights into project data, helping you spot inefficiencies and adjust resources proactively.
The Project Leadership Matrix
To understand how having the right tools facilitates proactive decision-making in practice, let’s say you’re managing a team tasked with modernizing the inventory system for a retail outlet. In this case, you would use a dedicated retail store accounting software to monitor costs, compile stock and order processing data, and allocate resources on a centralized platform.
Armed with all the information you need, you would analyze this data to determine where there are inefficiencies in the system so you know what needs to be improved. This will also allow you to create a detailed roadmap for the project in advance, thus keeping delays to a minimum.
Understanding project management analytics
Whether you’re carrying out on-site, hybrid, or remote project management, using data analytics correctly is essential for success. These give you a detailed overview of every stage of the project. They help you assess the current state of progress and tip you off to any potential problems that are emerging so you can nip them in the bud.
Phases of Project Management Plan
Typically, you’ll focus on analytics about the following factors:
- Resource allocation: Distributing your available resources appropriately is vital. You’ll likely need to make adjustments as the project proceeds, and some tasks become more resource-hungry than initially expected.
- Timeline: Letting the timeline slip too far should cause serious concern. The client reasonably expects you to deliver the project on time, so if there’s a hold-up, you need to know about it as soon as possible so you can resolve whatever’s causing it.
- Costs: Budget overruns can spell disaster, particularly if not enough contingency has been built in. So much so that recent research from McKinsey found that up to 45% of large IT projects end up exceeding their allocated budget, delivering 56% less value. Monitoring cost-based metrics consistently then, lets you have full visibility into the money and gives you a chance to raise any potential financial issues with stakeholders before you reach a crisis point.
- Risk management: You can’t always foresee the unexpected, but you certainly can plan for knowable risks. Identify the likelihood of each one occurring and assign it a value for how severe the impact would be if it does happen. That way, you can plan to mitigate the negative effects in advance.
- Quality control: Be vigilant about the quality of output. Track metrics such as defect rate and time to repair so you can maintain consistently high quality and good standards throughout the project.
Using analytics for improved decision-making
Let’s examine the steps to incorporate analytics into your project management decisions. There are four main stages: gathering data, identifying goals, generating actionable insights, and using analytics to inform future strategies.
Choose the right tools and gather your data
The first step is to collect your data using appropriate tools. There are a number of broad areas you’ll have to focus on, including:
- Time and workflow management: You’ll need to have a system in place for gathering data about how each element of the project is progressing. You can use collaboration software to monitor tasks, view how individual sprints are coming along, and ensure everything is running to schedule.
- Resource management: Allocating resources efficiently is the key to the effective delivery of any project. As part of your consulting firm technology suite, professional services automation software can help you optimize resource allocation and identify any potential bottlenecks before they cause a problem
- Cost monitoring: It’s all too easy for costs to spiral if you don’t track them closely enough. Check in on the budget regularly and compare estimated with actual costs as you go. That way, you’ll be able to identify whether any aspect of the project is out of alignment and make changes if required.
- Scope management: Scope creep is a common problem, with up to 50% of projects experiencing it—particularly longer ones. Keep a close eye on how many changes are being approved and be ready to reallocate resources if necessary.
Identify your key analytics and goals
The metrics you choose to monitor should give you comprehensive visibility into every aspect of your project. But it’s important to be selective. Remember that you’re not collecting data for the sake of it. The core objective is to derive actionable insights, so make sure the ones you use are aligned with your overall project goals.

Determine relevant KPIs, including some of the following:
- Budget and cost management: Total budget vs. total cost; cost variance; ROI
- Resource management: Resource utilization ratio; employee churn
- Timeline: Task completion rate; average time taken on tasks; milestones met; on-time delivery rate
- Team performance: Cycle time; collaboration index; completed task quality; absenteeism
- Stakeholder satisfaction: Customer satisfaction; net promoter score; retention rate; engagement rate.
When you’ve decided on your chosen metrics, create a plan for monitoring them regularly. This should take priority in your schedule since these are the indicators you’ll use to generate the insights you need to make crucial decisions throughout the project.
How to translate data into actionable insights
To derive actionable insights from your data, you need to present the raw figures in an accessible way. You can do this using a variety of data visualization tools. These are terrific for helping you identify trends and anomalies that aren’t always easy to spot from looking at the numbers alone.
The best choice of tool to use will depend on the type of data to be displayed. Here are a few examples:
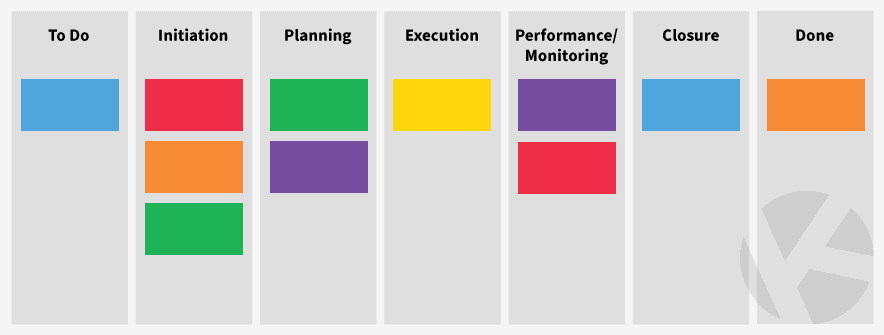
- Kanban board: This groups tasks vertically by status on cards that you can rearrange; the focus is on throughput, which makes it good for optimizing productivity.
- Dashboard: Excellent for tracking progress in hitting milestones, budget use, and employee workload.
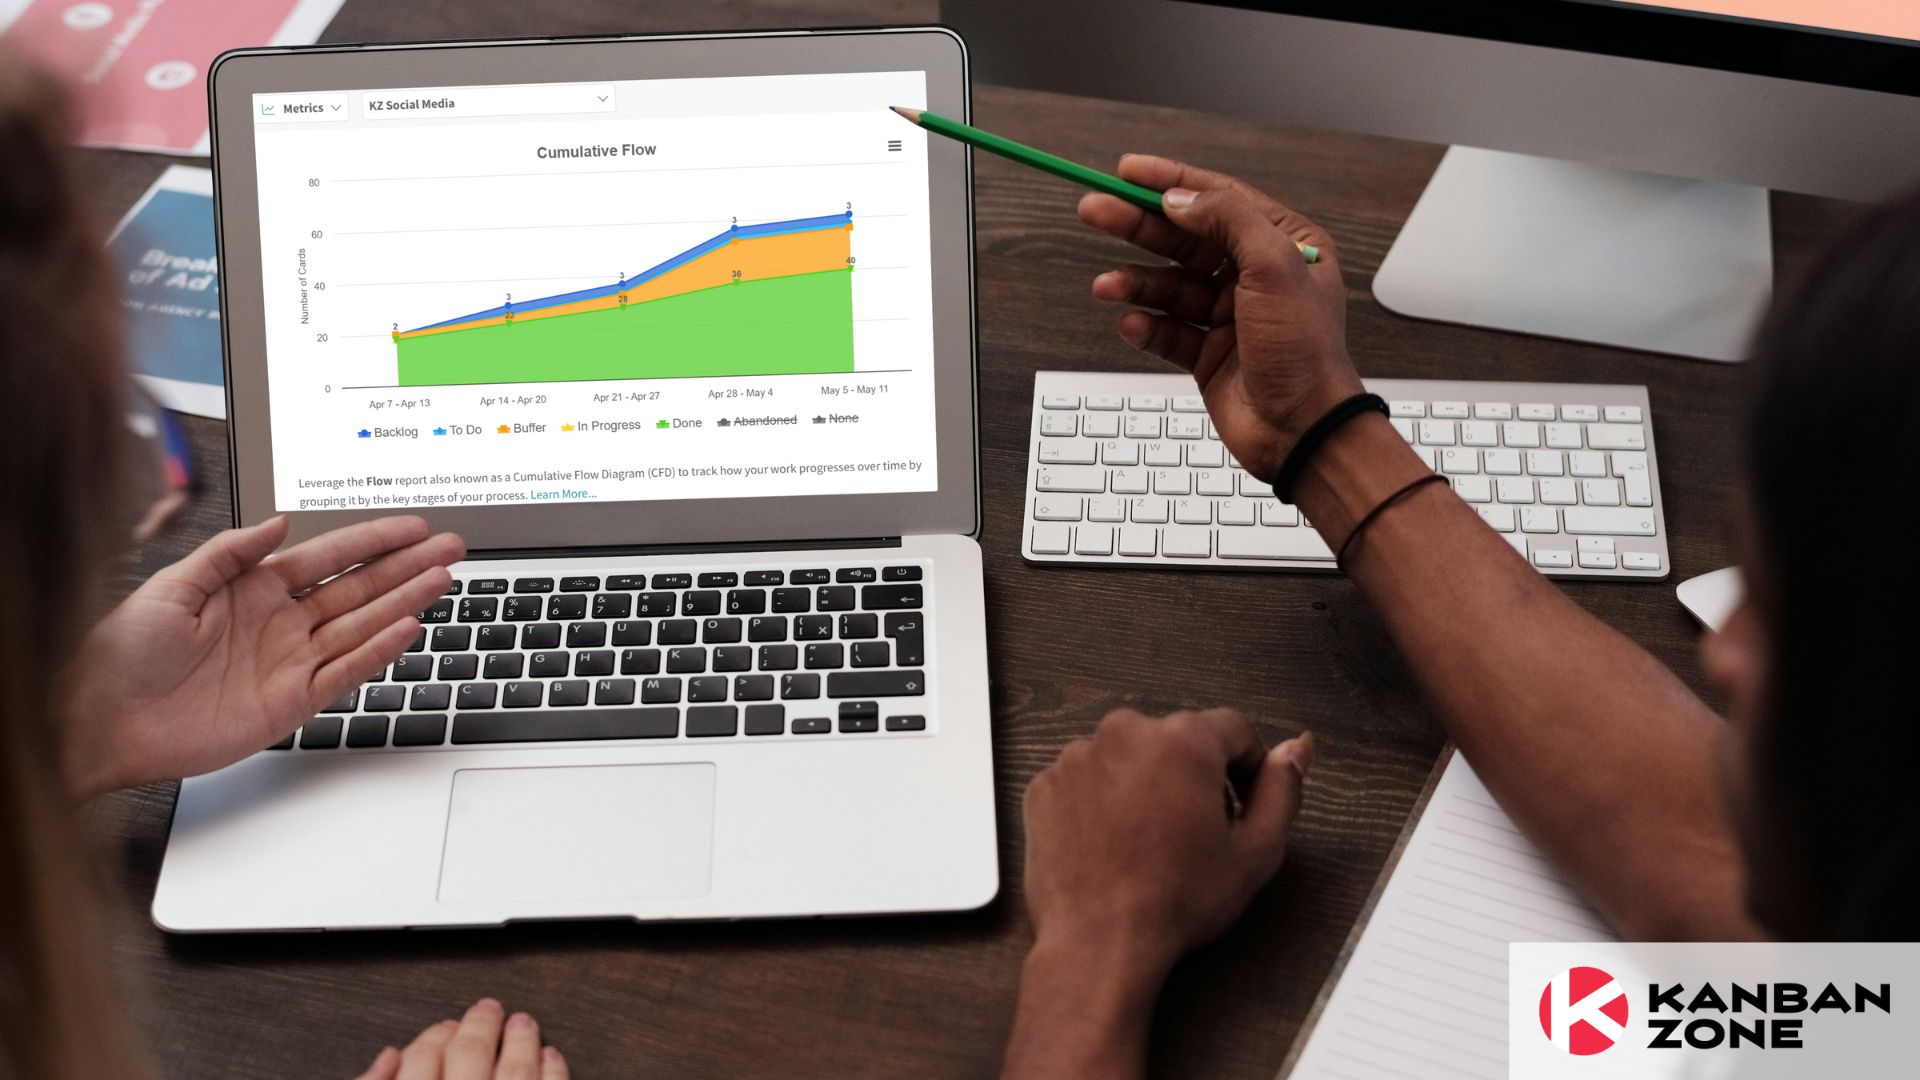
- Charting tools: Translate data into user-friendly chart visuals for easier strategic analysis.
You can use a mixture of these tools to arrive at the kind of insights that will significantly increase process efficiency in your project. That way, you can make sure it remains on schedule.
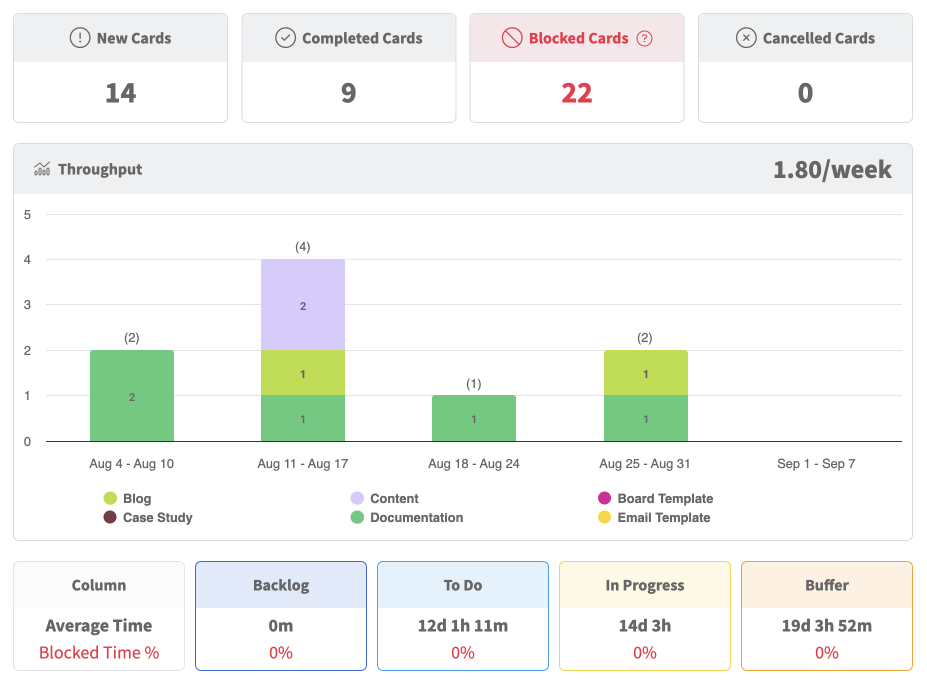
You can take advantage of Kanban Zone’s metrics dashboard to review your team’s productivity. Find out how it can help improve your project management and decision making processes.
Integrate analytics into your future strategies
One of the best aspects of using analytics in project management is that you learn something new each time. Insights gained from previous projects give you a foundation to build on to fine-tune future strategic initiatives.
Over time, you’ll hone your techniques and build up a collection of tools that smooth the way for other projects. It’s the very definition of a virtuous circle.
Key takeaways
Keeping a project on budget and delivering it to schedule can pose a challenge. But there’s no doubt that planning ahead and making decisions proactively makes a huge difference. The more you understand how the project fits together, the easier it is to make those decisions and keep everything running smoothly.
That’s why visualizing your projects and leveraging analytics to generate actionable insights is crucial. This ensures that you always have all the information you need to make adjustments where necessary and keep your project on track. The result? Your team enjoys the satisfaction of a job well done, and your clients are happy. Great news all around.
In conclusion, effective project management is not just about reacting to issues as they arise, but about anticipating challenges and making informed decisions proactively.
By leveraging project management analytics and tools like Kanban boards, you can visualize your project’s workflow, track key metrics, and gain valuable insights that drive proactive decision-making. This approach not only helps you keep your projects on track and within budget but also leads to improved team performance, client satisfaction, and overall project success. Remember, a well-visualized project is a well-managed project. Visualize projects better with Kanban Zone. Start your free trial today!
This was a guest blog. Please review our guest blog disclaimer.
Learn to Work Smarter, Not Harder!
Get our top articles weekly.
Table Of Contents
Discover many more posts…


