


One of the common reasons why teams use Kanban is to visualize their workflow. Through a Kanban board, teams can track their progress and spot any bottlenecks in their system. But did you know that other Kanban tools provide insights about your team’s work? One of these tools is called the Cumulative Flow Diagram or a CFD chart.
CFD charts are a powerful tool that Kanban teams can use to measure flow and analyze trends about a team’s performance. Think of a CFD chart as a storyteller. It paints a picture of how workflows through your Kanban system within a period. With this information handy, teams can diagnose problems and improve their process to create a more stable and predictable flow.
What is a Cumulative Flow Diagram?
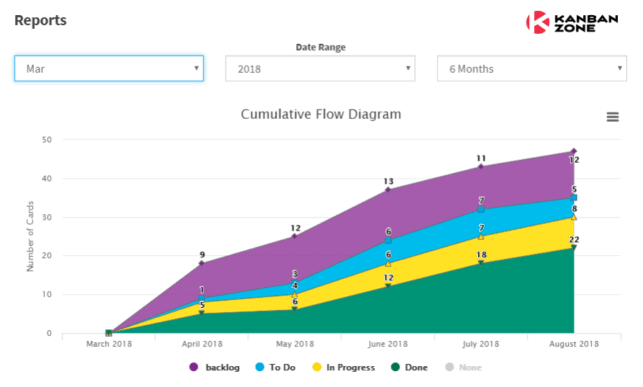
A Cumulative Flow Diagram is a graphical representation of work as it flows through your Kanban system. It is a time-based plot, with the time interval in the x-axis and the number of cards in the y-axis. The graph is divided into different colored bands, with the bands representing a state or column in your Kanban board.
What Information Does a Cumulative Flow Diagram Provide
The topmost band in a cumulative flow diagram represents the items that your team needs to do, while the bottom band represents the items that your team has done. The bands in between represent the items that your team is currently working on or the in progress items. In our example above, the Backlog and To Do bands represent the To Do states. The graph generated can vary depending on the configuration of your CFD chart tool if you are using an application.
The Cumulative Flow Diagram shows how many items have moved from one state to another in a given period. Depending on the tool you’re using, it should be able to give you the actual count of items per band per time interval. You can determine how many items are still waiting to be done and how many items you’re currently working on.
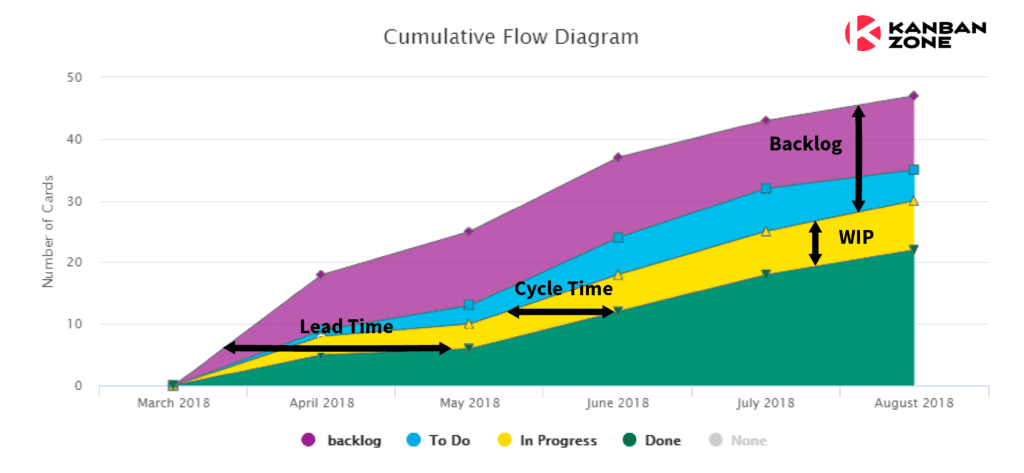
The CFD chart can also indicate your Lead and Cycle times, as shown in the image below.
The trajectory of the chart should be consistently upwards, with the bands staying more or less parallel and even in width. This means that you are delivering work at a stable pace. The exception is the Done band since it should widen over time indicating more items have been completed. But not all projects are perfect and there are times when an upwards slope is not achieved. Those times can be indications of possible issues within your workstream. The width of your bands can also indicate problems in your flow.
Here are some of the common patterns that you need to watch out for:
- Narrowing Bands – This indicates that there is lesser work than the team’s capacity. There may be a need to reallocate team members to balance out the workload.
- Widening Bands – Indicates a bottleneck. This means that the entry rate of the items to this state is faster than its exit rate. Analyze what is causing the holdup and apply corrective action.
- To Do band is wider than your Done band – Indicates that your team cannot consume the work as fast as you are adding them. This can mean several things which can include capacity problems and insufficient information about the tasks.
- Slope is flat – Indicates that no work has been done. Not always a cause for alarm as this can happen during holidays or no workdays. But if this isn’t the case then you need to dig into why nothing’s getting done. Is there a problem with your production servers? Are your team members missing?
How to Use CFD to Improve Team Performance
The cumulative flow diagram provides insights that may not be apparent with just basing progress on a Kanban board. As the CFD chart includes historical data, it shows trends and patterns that depict the performance of the team through a given period. With a single view, one can be able to spot if a bottleneck is becoming a recurring problem within a process state. If there are deviations to what should be the trajectory or form of the chart, the team can apply corrective action immediately.
Since the CFD chart also shows performance metrics such as WIP, lead time, and cycle time, the team can use these data to estimate when they are likely to complete a project. If given a target release date, the team can use their historical performance on assessing whether they can meet it or not. The chart can also be used by management as a basis for capacity planning needs. Overall, the cumulative flow diagram is a very useful tool to measure the performance of a team and create a stable and predictable flow.
How to Get a Cumulative Flow Diagram Tool
If you’re using a Kanban tool, like Kanban Zone, you should be able to use a built-in CFD report generator within the application. With an online Kanban tool that has rich report features, you don’t need to do the analytics yourself. But if you want to get your hands on the data, you can do this manually through a spreadsheet and create the chart from scratch.
What you need to ensure though is that your team is making timely updates to your cards and moving them to their appropriate states. Else, your CFD chart will not be an accurate representation of your workflow.
Are you ready to give cumulative flow diagrams a try?
Learn to Work Smarter, Not Harder!
Get our top articles weekly.
About the Author: Lena Boiser
Related Posts


Table Of Contents
Discover many more posts…


