Knowledge Base
-
Getting Started
-
Account - Personal
-
Account - Organization
-
Plan and Billing
-
Users
-
Boards
- Add a New Board
- Add Members to a Board
- Automation
- Board Background
- Board Groups
- Board Restrictions
- Card Aging
- Card Blocking Settings
- Card Labels
- Column States
- Column Watching
- Copying a Board
- Data Retention
- Delete a Board
- Edit a Board
- Explicit Agreements
- Filter Cards on a Board
- Search for Boards
- View Members of a Board
- WIP Limits
- Show all articles ( 5 ) Collapse Articles
-
Cards
- Add a New Card
- Archiving and Unarchiving a Card
- Attachments on Cards
- Automation
- Blocking Cards
- Card Aging
- Card Cover Image
- Card History
- Card Labels
- Card Metrics
- Card Templates
- Comments on Cards
- Copy Cards
- Custom Fields
- Deleting a Card
- Edit a Card
- Exit Criteria
- Filter Cards on a Board
- iFrame Cards
- Import and Export Cards from CSV
- Importing from Trello
- Links on Cards
- Mirror Cards
- Move Cards
- Planned vs Actual Dates
- Recurring Cards
- Search for Cards
- Tokens
- Voting on Cards
- Watch a Card
- Show all articles ( 15 ) Collapse Articles
-
Checklists & Tasks
-
Productivity Zones
-
Metrics
-
Search
-
Integrations
Print
Card Metrics
In this article
Access
- Open a card by clicking it
- Click the first tab on the left top see the Card Metrics
Use
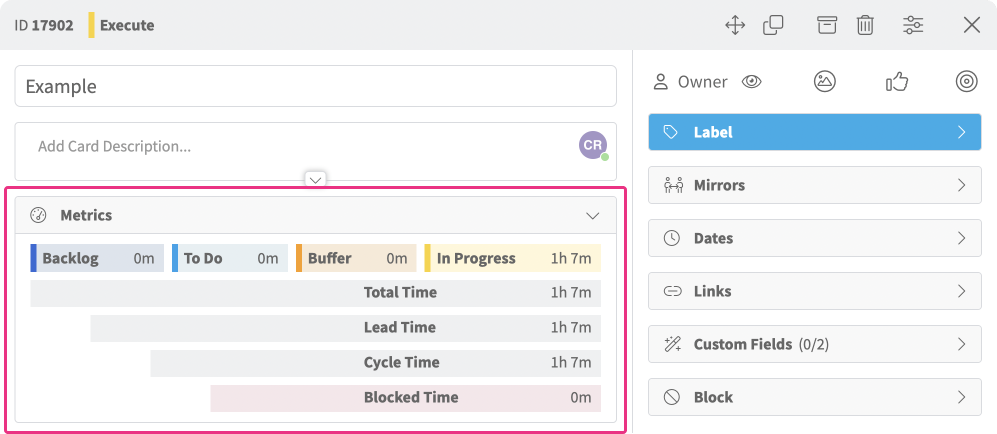
Once the Card Metrics tab is open you see the metrics organized in three sections:
- Lead Time tracks the time a card stays in a blue Backlog or Start column (not in WIP yet).
- Cycle Time tracks the time a card stays in a yellow In Progress or orange Buffer column (WIP).
- Total Time tracks the time a card took from the time it was created to when it entered a green Done column.
The time includes all days (week and weekend), so if a card was created on Tuesday at 9am and completed the following week on Tuesday 9am, then it will show a total time of 7 days.
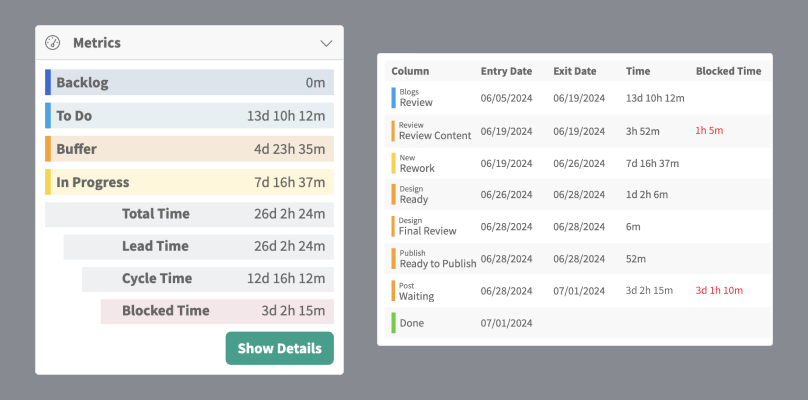
Show Details
Below your column metrics, you can click the Show Details button. Once clicked, the same card metrics data will be displayed but at the column level. Each column stays associated with the corresponding colored column state, but now you have detailed data to analyze exactly what happened to this card.


