

After a little summer break, we are excited to announce our new Card Layout and Kanban Options which will allow you to customize the look of cards on your Kanban boards. We have also improved our Metrics area with 3 new reports and the ability to show/export the data behind ALL reports.
Improved Card Layout
The first big change and #1 customer request we have received has been related to the colored card labels. Previously, cards only showed the label color as a small badge in the top/right corner, but we’ve heard your feedback and have made the card colors more prominent and easily identifiable.
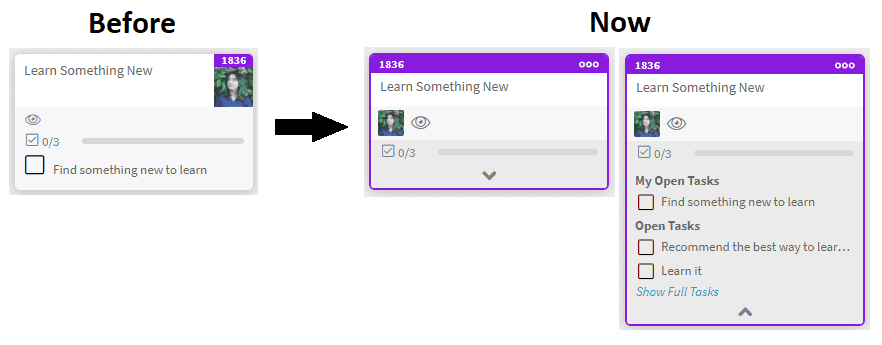 Previously only open tasks for the user logged in would appear on the card. Now you can view all your open tasks by expanding the task progress bar as well as all other open tasks on the card. As always you can click the open checkbox to instantly mark a task as done.
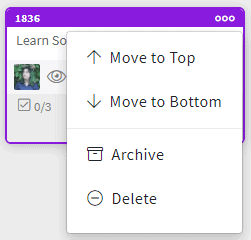
We have also added a card menu to quickly Move a card to the top or bottom of a column, as well as quick actions like Archive and Delete. We will be adding more quick actions in the future.
Kanban Options
Under the Kanban zone, there is a new icon called Kanban Options, situated between Settings and Metrics. Once clicked, it will permit you to customize the look of your cards on a board. Many options are now available to display (or not) on cards and we also added a new section on cards to show planned dates.
You will also notice a section to change the column width. We always design everything to work well on mobile and smaller displays, but for clients using larger displays, you can now see your cards in two larger formats by choosing 125% and 150%.
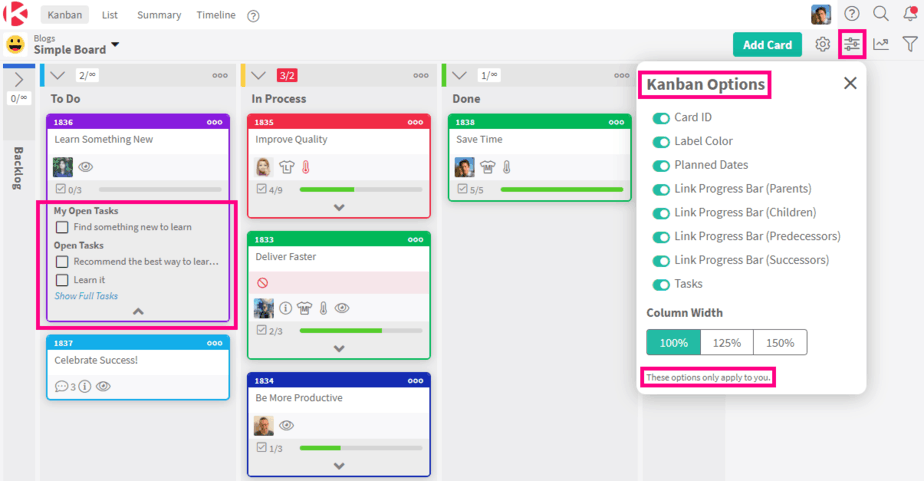
As noted at the bottom of the Kanban Options menu, these options only apply to you, so any changes you make will only affect you.
Improved Metrics
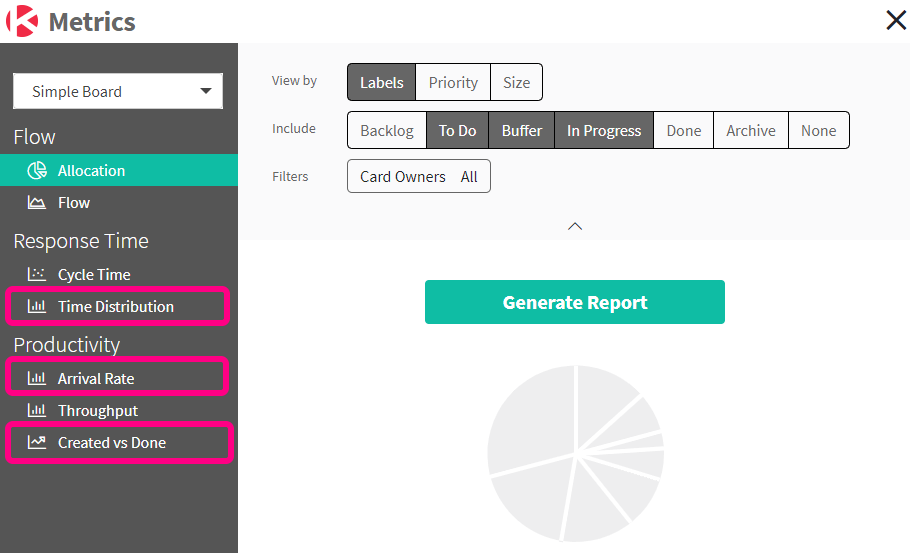
We have added three new reports to help you analyze your work.
- Time Distribution – Improve your forecasting by tracking the accumulated percentage time it took your cards to get done. Learn more about the Time Distribution report…
- Arrival Rate – Track the number of cards that were created within a specified period of time. Learn more about the Arrival Rate report…
- Created vs Done – With the addition of the Arrival Rate report that functions exactly like the Throughput report, you can now compared how many cards were created versus done. Learn more about the Created vs Done report…
Once you generate a report, you will now see a new “Show Details” button, which will display the data associated with the data shown on the chart.
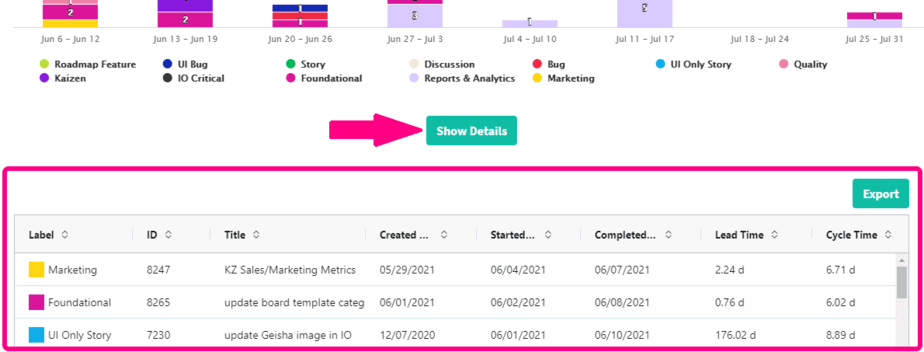
You can sort, filter and export this data.
As always, if you find an issue or feel something could be improved, please don’t hesitate to send us your feedback so that we can continue to improve Kanban Zone. You will never hurt our feelings, so don’t be shy. We would love to hear from you because your feedback is important to us.
– The Kanban Zone Team


