Track your success.
The Kanban method provides the ideal way to achieve your goals by following these five Kanban properties: visualize the workflow, limit the Work-In-Progress (WIP), make the process explicit, use models to recognize improvement opportunities, and measure and manage the flow. Our metrics area is an absolute playground for the most advanced Kanban users to truly slice and dice their data, in order to help their organizations make better decisions based on actual data.
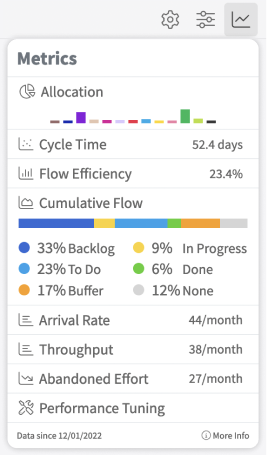
As shown in the screenshot on the right, you can access the most important Kanban metrics from each board by clicking the metrics icon. This provides a quick glance at your metrics for the last 4 weeks, but don’t just stop here, click any of these metrics to access the full metrics area with much more reports and ways to analyze your data.
You can learn more about the reports available in Kanban Zone in the list below. Unlike many other tools that require additional plugins to access advanced analytics, you can rely on accurate data without all the complications of maintaining any integrations. Our metrics can help you quickly visualize your work and identify opportunities for improvement.
See it in action
Enjoy this short video that will illustrate our metrics and take a deep dive into our Performance Tuning report.
Performance Tuning
This stand-alone report provides a single view to analyze multiple aspects of your team/process.
- Performance Tuning – to identify your bottlenecks, see multiple key performance metrics and understand your lead/cycle time to compare how long it took from the perspective of your customers vs how long it took internally to do the work
Streamline
These reports will help you improve the way you balance and flow your work so that you can make your organization or system more efficient and effective.
- Allocation – to better balance the work being worked on by your team or process
- Flow – also known as a Cumulative Flow Diagram (CFD) to track how your work progresses over time by grouping it by the key stages of your process
- Flow Efficiency – to get your flow efficiency score and see which cards had a good flow vs the ones that didn’t
Response Time
These reports will help you understand how long it truly takes you to complete work so that you can track how you improve your delivery of work over time.
- Cycle Time – to track how long it takes for your work to get completed in order to determine the responsiveness of your team or process
- Time Distribution – to forecast how much time it takes to complete work based on your past results
Productivity
These reports will let you know exactly how much work you receive and complete so that you can adjust your resources to increase your productivity.
- Arrival Rate – to track how much work you are receiving so that you can better understand your upcoming pipeline of work and set better expectations
- Throughput – to track how much work you are completing so that you can set better expectations by declaring your true team or process capacity
- Created vs Done – to see if your team or process is completing more or less work than they receive within a specific time period
- Abandoned Effort – to track your wasted effort based on how many cards you started but abandoned prior to completing these
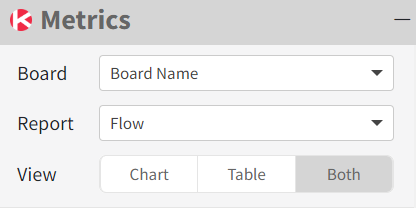
Metrics Selections
Our metrics area provides the ability to select a specific board within your organization, switch between reports and choose to only see a graph or a table, or both. Some graphs provide multiple options to display the graph. The table shows all the data related to the information shown on the graph. These tables function like our Table zone by providing extremely customizable ways to interact with your data, group, sort, filter, export, and even create more specific charts.
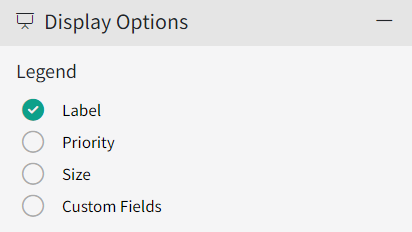
Display Options
Some reports have the ability to select the way you want to display your information by selecting the legend that will show next to the chart. The first three options are standard fields on cards (label, priority, size) and the last option provides the ability to leverage your custom fields.
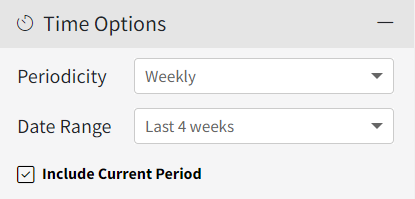
Time Options
Some reports have the ability to select a specific periodicity (daily, weekly, monthly, quarterly) and a customizable date range. You also get the choice to include the current period or not.
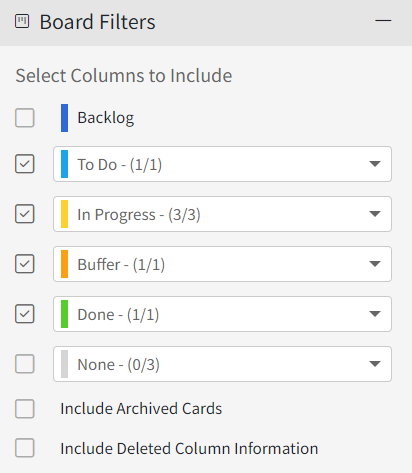
Board Filters
Some reports have the ability to select specific column states (backlog, to do, in progress, buffer, done, and none) and within each of these column states, you can also select specific columns. This gives you full control over the data to be included in your report. The cycle time report is one of the reports that highly benefits from these board filters, as it lets you target exactly which columns you want to include in your cycle time.
We also offer the ability to include archived cards, as these are no longer shown on the board but could hold helpful data for your analysis. For some of you who have made significant modifications to your boards, you might want to include deleted column information., so we provide this option if applicable to your situation.
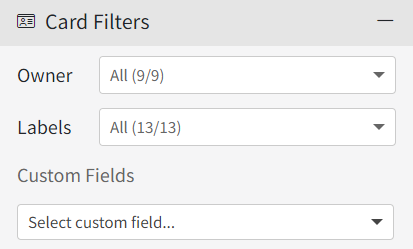
Card Filters
Some reports have the ability to filter the data displayed on the chart based on specific card filters. The card owner filter is very helpful to target the contributions of specific members. The card labels are a very important aspect of any board you crate in Kanban Zone, as these serve as your main way to categorize the work that flows on your board. Lastly, you can select any of your custom fields to truly dive deeper into your data.


Already Using a Collaboration Solution?
Seamlessly migrate your data to Kanban Zone. Our team of experts will ensure a smooth transition and assist you every step of the way. We can assess your current setup, design your ideal system and help you migrate your work.
See for yourself why it’s worth the switch.


